In our last session, we introduced dummy variables as a way to include categorical data in a regression model. We established the concept of a base category and learned that the coefficient for a dummy variable represents a shift in the model's intercept. Now, we'll sharpen that understanding to focus on the precise skill your exam demands: writing a perfect sentence that explains the estimated difference in the outcome between two categories.
This lesson is entirely dedicated to mastering that interpretation. We'll refine the sentence structure, visualize what this "difference" means, and tackle a practice problem to ensure you can deliver a clear, concise answer under exam pressure.
The Coefficient as a Measure of Difference
Remember that a linear model with a single binary dummy variable (e.g., sex, coded as 0 for female and 1 for male) predicting a response (e.g., salary) takes the form:
- For females (
sex= 0), the predicted salary is: - For males (
sex= 1), the predicted salary is:
The crucial insight here is that the coefficient is precisely the difference between the predicted average salaries of the two groups:
So, the coefficient is the estimated average difference in salary for males compared to females.
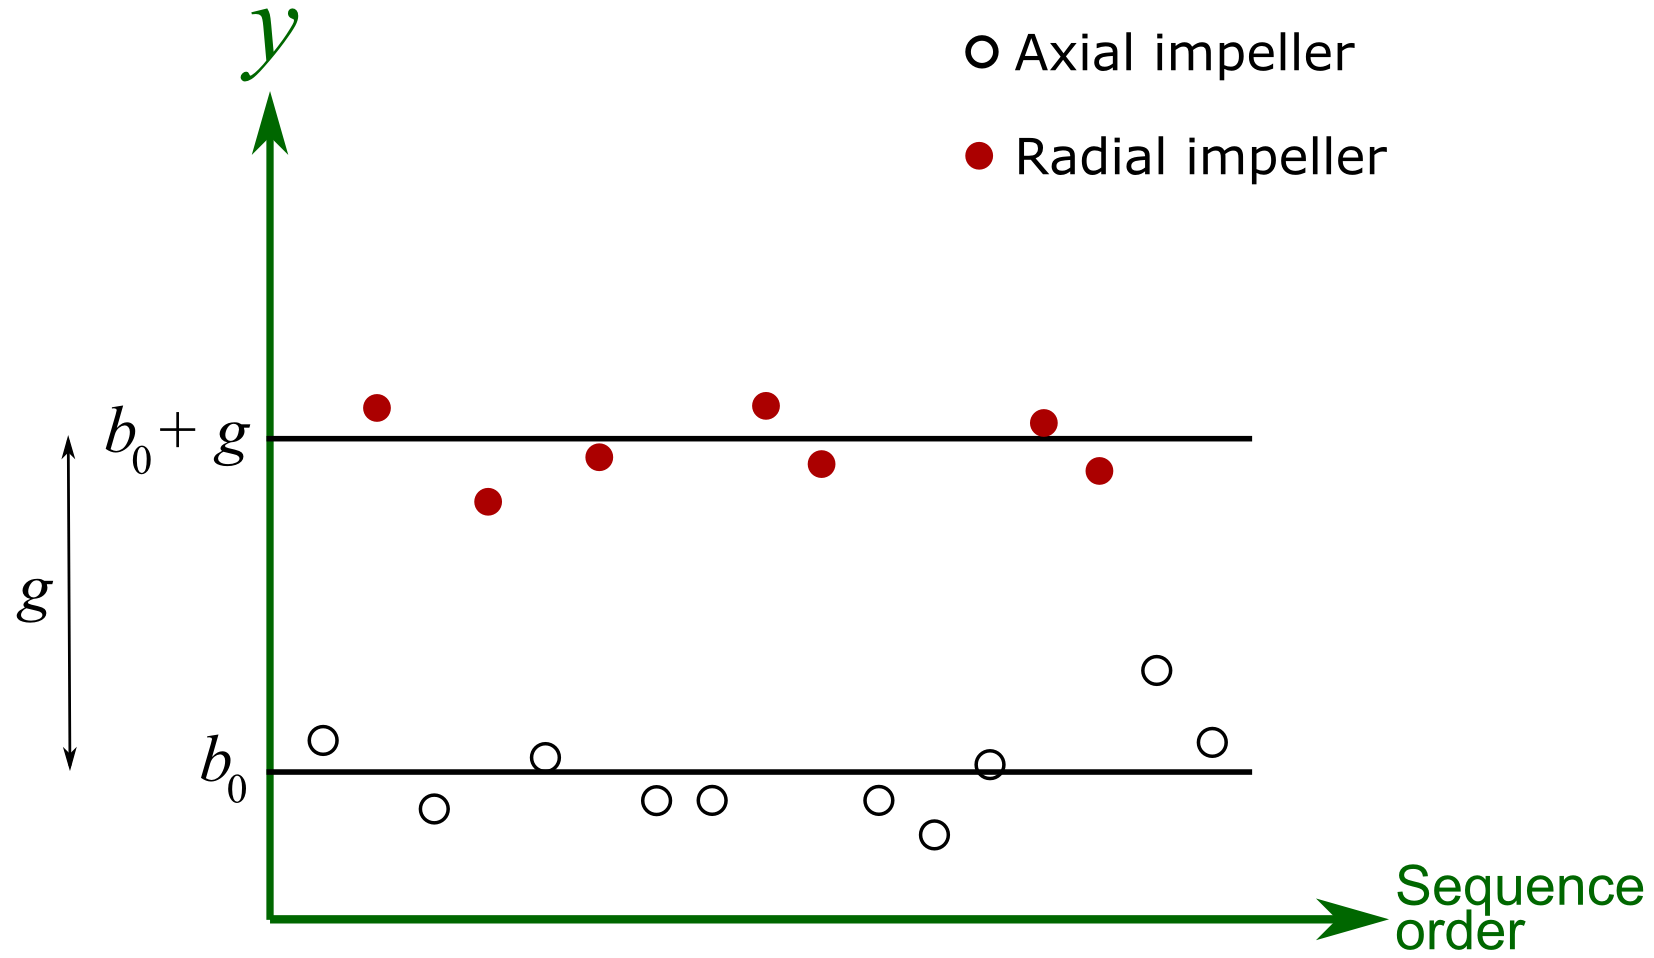
This concept is visualized well in the image below. Imagine the 'Axial impeller' is our base category. Its average response is . The 'Radial impeller' is the other category, and its dummy coefficient is . Its average response is . The coefficient directly represents the average difference between the two groups.
Crafting the Perfect Exam Sentence
For your exam, you need a precise and repeatable sentence structure. Here is a template you can adapt.
Exam-Style Sentence Template:
The predicted value of [Response Variable] for an observation in [Category of Interest] is, on average, [Coefficient Value] units higher/lower than for an observation in the [Base Category], holding all other variables constant.
Let's see this in action with a clear example from the STHDA article on regression.
Regression with Categorical Variables: Dummy Coding Essentials ...
This article provides an excellent, practical walkthrough of interpreting dummy variables. It starts with a simple binary case and then moves to a multiple regression context, both of which are critical for your exam.
First, read the initial section, Categorical variables with two levels, to see how the coefficient for sexMale is interpreted as the average salary difference. Then, skip to the multiple regression example under the summary(model2) output. Focus on the interpretation provided for the disciplineB variable. This is a model answer.
The interpretation for disciplineB in the article is "being from discipline B (applied departments) is significantly associated with an average increase of 13473.38 in salary compared to discipline A (theoretical departments)."
To make this a perfect exam answer, we just need to add our critical clause:
The predicted salary for a professor in discipline B (applied departments) is, on average, $13,473.38 higher than for a professor in discipline A (theoretical departments), holding years of service, rank, and sex constant.
Notice how this sentence specifies:
- The two groups being compared (Discipline B vs. Discipline A).
- The magnitude and direction of the difference ($13,473.38 higher).
- The crucial context ("holding all other variables constant").
Practice Drill
You are given the following R output from a model predicting a dependent variable DV using several predictors, including a categorical variable with 5 levels. Category 1 is the base category.
Coefficients:
                         Estimate Std. Error t value Pr(>|t|)
(Intercept)              -0.42367    0.30694  -1.380 0.16842
Age                      -0.05949    0.02026  -2.936 0.00356 **
Gender                   -0.01800    0.04828  -0.373 0.70952
factor(Categorial)2      -0.30625    0.12645  -2.422 0.01596 *
factor(Categorial)3      -0.03441    0.07752  -0.444 0.65736
factor(Categorial)4      -0.12603    0.09914  -1.271 0.20453
factor(Categorial)5      -0.08417    0.13269  -0.634 0.52630
Continuous 1              0.12080    0.04346   2.779 0.00575 **
...
Your Task:
Using the perfected sentence template, write a one-sentence interpretation for the factor(Categorial)2 coefficient. State whether the difference is statistically significant at the level.
Solution
The predicted value of the dependent variable (DV) for an observation in Category 2 is, on average, 0.30625 units lower than for an observation in the base category (Category 1), holding all other variables constant. This difference is statistically significant at the 5% level because its p-value (0.01596) is less than 0.05.
Common Exam Trap: Comparing Two Non-Base Categories
A common mistake is to misinterpret the coefficient of one dummy variable as the difference between it and another non-base dummy variable.
In the practice drill, the coefficient for factor(Categorial)3 (-0.03441) represents the difference between Category 3 and Category 1 (the base). It does not represent the difference between Category 3 and Category 2. To find the difference between Category 3 and Category 2, you would calculate , but you cannot immediately know if this difference is statistically significant without performing a specific hypothesis test (a "contrast"), which is beyond our immediate scope.
For your exam, always state the comparison relative to the base category.
Conclusion
You have now focused on one of the most fundamental interpretation skills in regression. By mastering the structure of this sentence, you ensure your answers are precise, complete, and directly address what the model is telling you about group differences.
Key Takeaways:
- A dummy variable's coefficient is the estimated average difference in the response between that category and the base category.
- Your interpretation must always include the direction (higher/lower), magnitude (the coefficient value), and the context ("holding all other variables constant").
- Avoid the trap of comparing two non-base categories directly from their coefficients.
In the next lesson, we will move to one of the most interesting concepts in regression: interaction terms. We will see what happens when the effect of one variable, like a person's years of experience, changes depending on the level of another variable, like their gender. This allows our models to capture much more complex relationships in the data.