In our last lesson, we explored how interaction terms allow the effect of one predictor to change based on the level of a categorical predictor, leading to regression lines with different slopes for different groups. We saw, for instance, that the effect of study hours on exam scores could be different for STEM and Arts students.
Today, we will build directly on that foundation to master a critical exam skill: calculating the slope of one predictor for different fixed values of another predictor. This technique, often called "simple slopes" or "spotlight" analysis, is essential for interpreting interactions, especially when your model includes two continuous variables interacting with each other. By the end of this lesson, you will be able to take a regression output with an interaction and precisely state the effect of one variable at different, meaningful levels of another.
The Slope of X as a Function of Z
In the previous lesson, we saw that for a model with a continuous predictor (X) and a binary moderator (Z), the slope of X was for the reference group (Z=0) and for the other group (Z=1).
Now, what if the moderator Z is also a continuous variable, like age or experience_years? The model equation remains the same:
The key insight is that the effect of X on Y is no longer a single number; it is now a function of Z. We can see this by rearranging the terms of the equation:
Look closely at the term in the second parenthesis. This is the coefficient of X.
- The slope of X is .
This means for every one-unit increase in X, Y is predicted to change by . The slope itself depends on the value of Z. The following video provides an excellent conceptual recap of this idea.
Econometrics - Interaction Terms
This video from the "Econometrics, Causality, and Coding with Dr. HK" channel clearly explains why the effect of one variable becomes dependent on another in an interaction model.
Focus on these two key segments: The core concept: The presenter derives the effect of X as beta1 + beta3 * z. This is the central formula you need to master. Plugging in values: Watch how he calculates the effect of X for different values of Z (Z=0, Z=1, Z=3). This is precisely the skill we are developing in this lesson.
Spotlight Analysis: Calculating Slopes for a Continuous Moderator
Since Z is continuous, it can take on infinitely many values. We can't calculate the slope of X for every single one. Instead, for exam purposes, you will use a standard method called spotlight analysis. This involves calculating the slope of X at a few representative values of the moderator Z.
The standard convention is to choose three values:
- Average level of Z: The mean of Z, .
- High level of Z: One standard deviation above the mean, .
- Low level of Z: One standard deviation below the mean, .
You then plug these three values into your slope equation, , to get three different "simple slopes" for X.
The following reading demonstrates this calculation with a clear, step-by-step example.
[PDF] Simple Slopes Following the discovery of a significant interaction, it ...
This document by Jason Newsom provides a concise and direct explanation of how to compute simple slopes from an interaction equation.
First, read the section on rearranging the equation. This reinforces the core formula we just discussed. Then, carefully study the full worked example. The author uses a hypothetical regression equation and plugs in the values for Z at -1 SD, the Mean, and +1 SD to calculate the three simple slopes of X. This is exactly the procedure you need to replicate on your exam.
After calculating these slopes, you can visualize them as three distinct regression lines, showing how the relationship between Y and X changes as Z changes.

How to Interpret Simple Slopes Output
On an exam, you might be given an output table that has already calculated these simple slopes for you. Your task is to interpret it correctly.
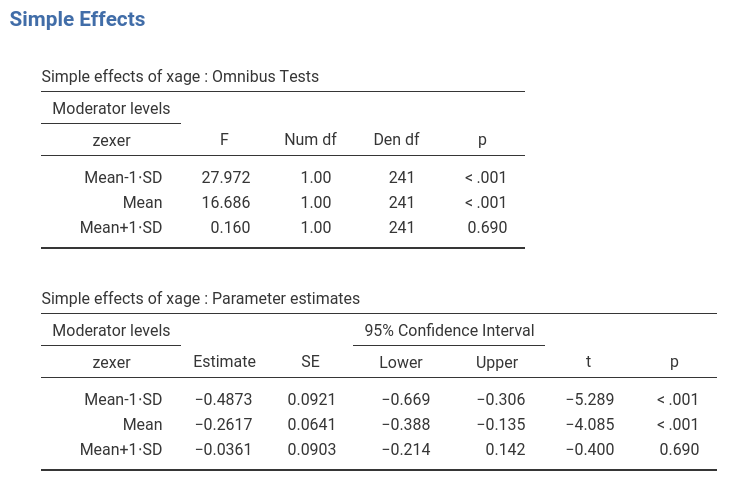
What to look for and how to interpret it:
- Moderator Levels: The first column shows the specific values of the moderator (
zexer) used for the calculation (Mean-1SD, Mean, Mean+1SD). - Estimate: This is the key value. It is the calculated slope of the predictor (
xage) at that specific level of the moderator.- Exam-style sentence: "When
zexeris one standard deviation below its mean, the slope ofxageis -0.4873. This means for a one-unit increase inxage, the response is predicted to decrease by 0.4873, at this specific level ofzexer."
- Exam-style sentence: "When
- p-value: This tells you whether that specific simple slope is statistically significant (i.e., different from zero).
- Exam-style sentence: "The relationship between
xageand the response is statistically significant whenzexeris at its mean (p < .001) and one standard deviation below its mean (p < .001), but it is not significant whenzexeris one standard deviation above its mean (p = 0.690)."
- Exam-style sentence: "The relationship between
This analysis is far more nuanced and precise than just looking at the main interaction coefficient. It tells you where the interaction is happening.
For those interested in the full manual derivation of these simple slopes, the following resource provides an excellent, though optional, walkthrough.
Decomposing, Probing, and Plotting Interactions in R - OARC Stats
This optional section provides a step-by-step manual calculation of simple slopes. It's a great way to solidify your understanding of how the interaction term b3 emerges as the "difference of differences".
In the article, find the section titled "(Optional) Manually calculating the simple slopes". Read through the derivation from here to see how the slope formulas m_{W=1} = b_1 + b_3 and m_{W=0} = b_1 are derived from first principles.
Practice Drill
You are analyzing housing prices and fit the following interaction model. The response is price (in thousands of dollars), and the predictors are size (in square feet) and age (in years).
Model Output:
Coefficients:
                 Estimate Std. Error t value Pr(>|t|)
(Intercept)      150.000    10.000   15.00   <2e-16 ***
size               0.250     0.050    5.00    <2e-16 ***
age               -2.000     0.500   -4.00    0.0001 ***
size:age          -0.005     0.001   -5.00    <2e-16 ***
You are also given that for the variable age:
- Mean = 20 years
- Standard Deviation = 10 years
Your Task:
- Write down the general equation for the slope of
size. - Calculate the simple slope of
sizefor a house of average age (20 years). Interpret this slope. - Calculate the simple slope of
sizefor a new house (one SD below the mean age). - Calculate the simple slope of
sizefor an old house (one SD above the mean age). - In one sentence, what does this interaction tell you about the effect of house size on price?
Solution
-
General equation for the slope of
size:
Using the formula , the slope ofsizeis:
or . -
Slope for an average-aged house (age = 20):
Slope = .
Interpretation: For a 20-year-old house, each additional square foot of size is associated with a predicted price increase of $150. -
Slope for a new house (age = 20 - 10 = 10):
Slope = .
Interpretation: For a 10-year-old house, each additional square foot is associated with a predicted price increase of $200. -
Slope for an old house (age = 20 + 10 = 30):
Slope = .
Interpretation: For a 30-year-old house, each additional square foot is associated with a predicted price increase of $100. -
Overall Conclusion: The effect of house size on price diminishes as the house gets older; an extra square foot is worth more in a newer house than in an older one.
Conclusion
You have now learned how to probe an interaction term to find the simple slopes, which is a powerful and precise method of interpretation. This moves beyond simply stating "the effect depends" to explaining how it depends.
Key Takeaways:
- In a model with an interaction term , the slope of X is given by the equation .
- To interpret a continuous-by-continuous interaction, you calculate the slope of X at specific, representative values of Z.
- The standard approach ("spotlight analysis") is to use the mean of Z, one standard deviation above the mean, and one standard deviation below the mean.
- Exam outputs may provide these "simple effects" directly, and you must be able to interpret the slope (
Estimate) and its significance (p-value) for each level of the moderator.
This lesson completes our deep dive into interaction models. In our final lesson of this module, we will explore another essential technique for improving regression models: log transformations. We will see how transforming a variable can help fix violations of key assumptions like linearity and homoscedasticity.