Welcome to the fifth module of your crash course. Having mastered the essential diagnostic checks in the last module, you're now ready to tackle the core interpretation challenges of more complex models. We'll begin by moving from simple to multiple linear regression.
This lesson addresses the most critical distinction between interpreting a simple linear regression (SLR) and a multiple linear regression (MLR) model. While the slope in SLR has a straightforward meaning, the coefficients in MLR have a more nuanced interpretation that is absolutely essential to state correctly on your exam. By the end of this lesson, you will be able to interpret any individual slope coefficient from an MLR model with the precision your professor expects.
From a Line to a Plane: Visualizing MLR
In simple linear regression, we modeled the relationship between two variables, which we could visualize as a line on a 2D scatter plot. The slope of that line was unambiguous.
In multiple regression, we are modeling the relationship between a response variable and multiple predictor variables . With two predictors, our model is no longer a line, but a plane slicing through a 3D cloud of data points.
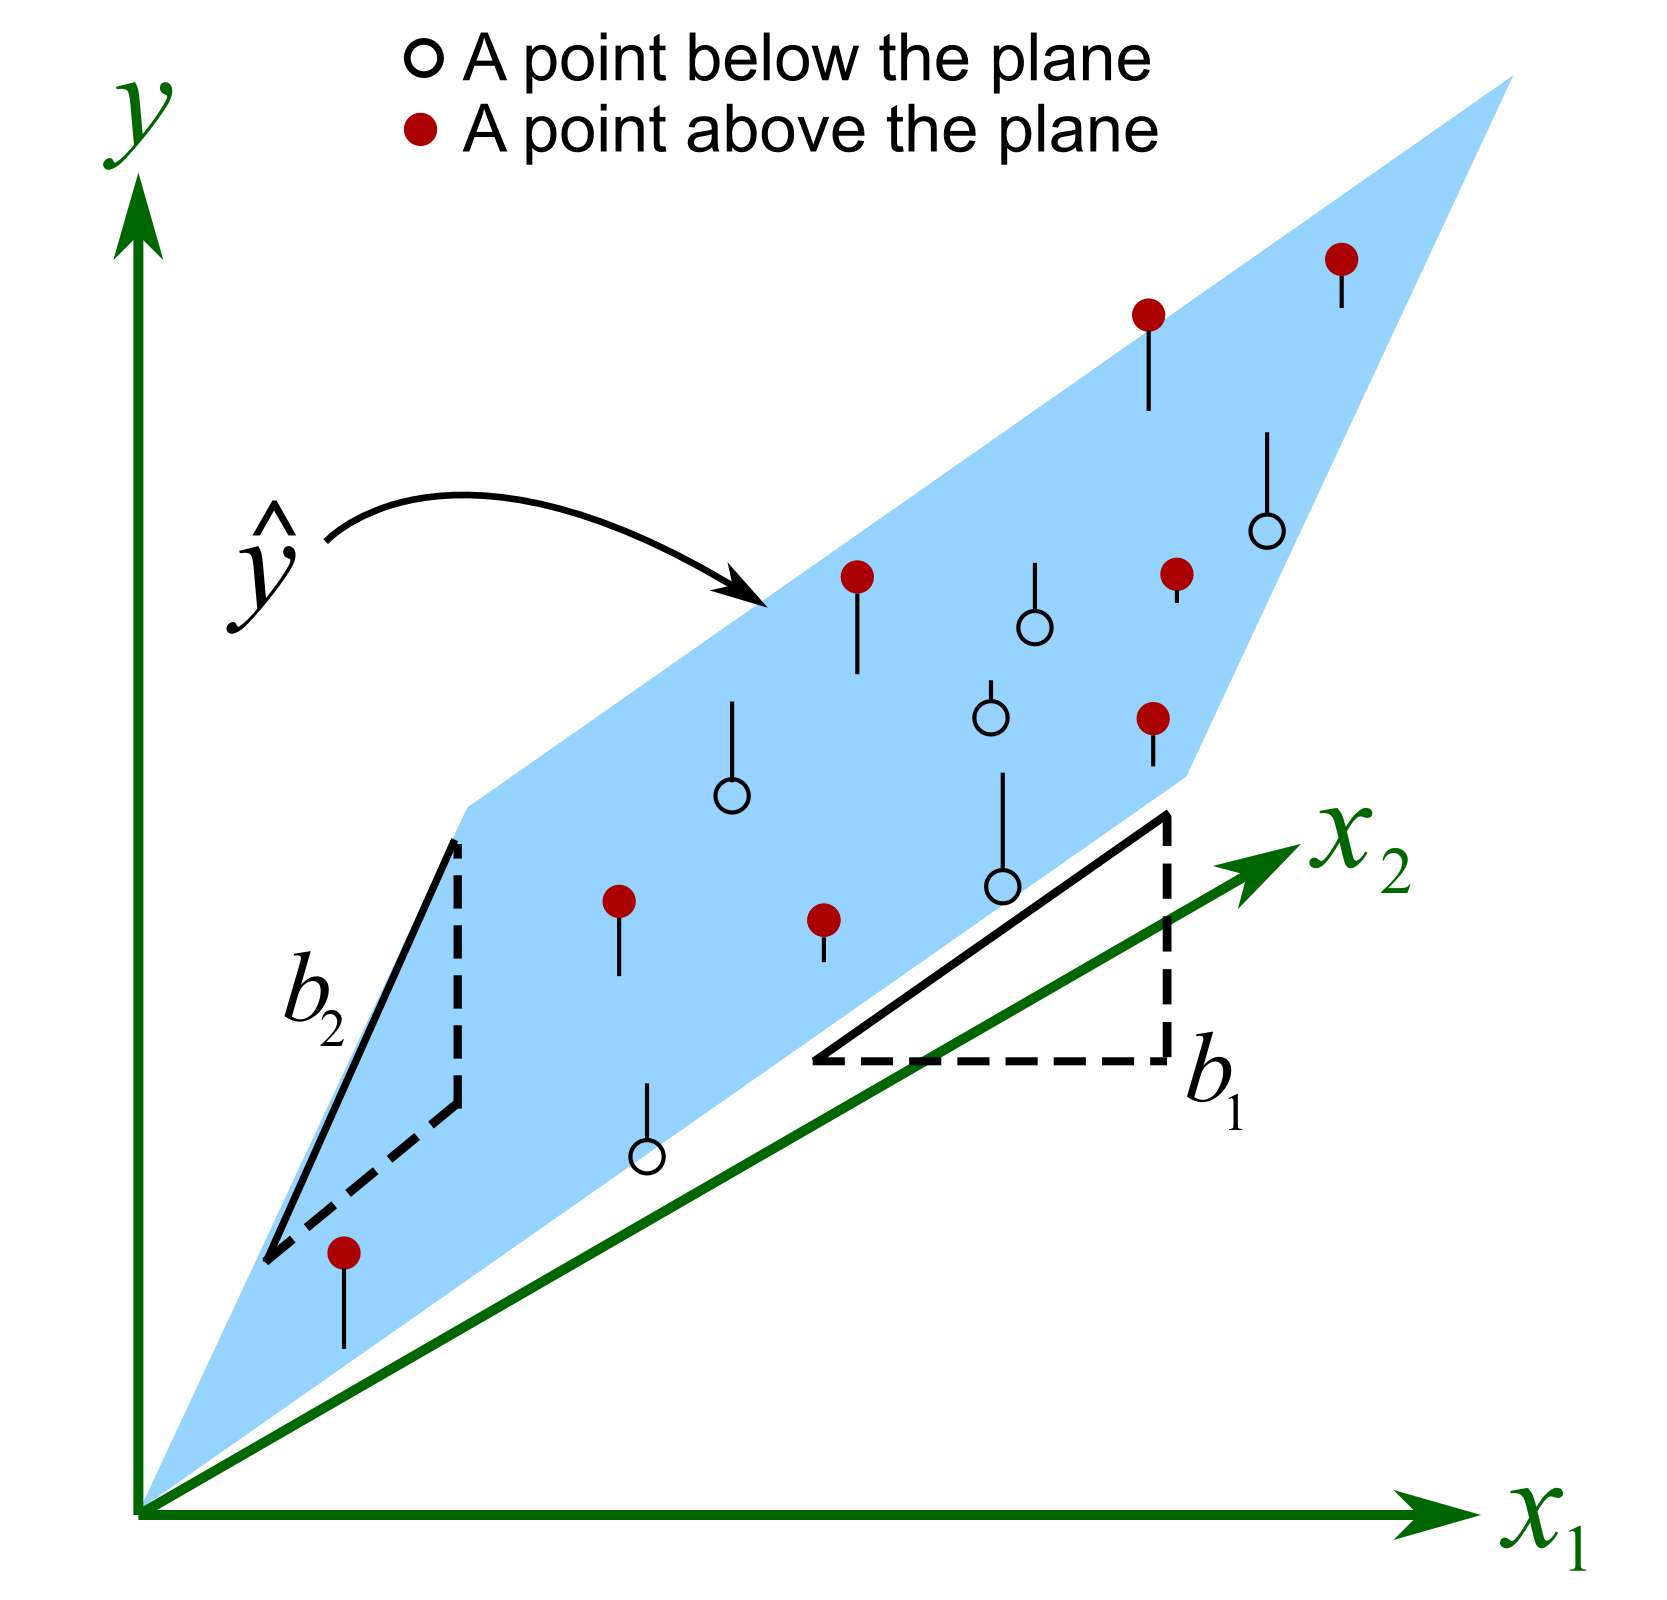
The equation for this model is an extension of the SLR equation:
The key question is: what does mean now that are also in the model? The coefficient represents the slope of the plane in the direction of the axis. To measure this, you must move along the axis while your position on the axis is held fixed. This is the geometric intuition behind the core concept of MLR interpretation.
The Golden Rule of MLR Interpretation
The most common mistake in interpreting MLR is to treat a coefficient like a simple slope. The presence of other variables in the model fundamentally changes the interpretation.
[PDF] Multiple Linear Regression (MLR) Handouts
This handout from the University of Chicago provides a concise and formal definition of how to interpret MLR coefficients.
On page 19 of the PDF, find the section titled "Interpretation of Regression Coefficients." Read the bullet point that defines βj. This is the most important sentence for this topic. Also, note the subsequent point about how the interpretation depends on what other covariates are in the model.
As the reading makes clear, the interpretation of any single coefficient is conditional on the other predictors in the model. This leads us to our exam-style template.
Exam-Style Sentence Template:
A one-unit increase in [Predictor Variable ] is associated with a []-unit [increase/decrease] in the predicted [Response Variable ], holding all other variables in the model constant.
Notice the use of "is associated with." This is a crucial distinction. Unless you have performed a rigorous causal analysis (which is beyond the scope of a standard regression model), you are describing a conditional association, not a causal relationship. Using "causes" or "leads to" is a common exam trap that you must avoid.
This short video provides an excellent summary of this rule and why the wording is so important.
How to Interpret a Coefficient in a Regression
This video from "Econometrics, Causality, and Coding with Dr. HK" offers practical advice on regression interpretation.
First, watch the segment from the beginning. The speaker provides a template sentence that you should memorize. Then, jump to the segment explaining the difference between association and causation. This directly addresses the exam trap of using imprecise language.
Why "Holding Others Constant" Changes Everything
This isn't just a phrase to memorize; it reflects a fundamental property of MLR. A variable's estimated effect can change dramatically—even reversing its sign—when other predictors are added to the model.
Let's consider a classic example: predicting house price.
- Model 1 (SLR):
Price ~ Bedrooms. In this model, you would likely find a positive coefficient. An extra bedroom is associated with a higher price. - Model 2 (MLR):
Price ~ Bedrooms + Square_Footage. Here, you might find that the coefficient forBedroomsbecomes negative. Why? The model is now telling you the effect of adding a bedroom while holding square footage constant. Adding a bedroom to a house of a fixed size means all the rooms (including the new bedroom) must be smaller, which could be less desirable and thus associated with a lower price.
The coefficient for Bedrooms in Model 1 and Model 2 are measuring different things. The first measures the simple association, while the second measures the association conditional on the house size.
The following reading demonstrates this exact phenomenon with R output.
[PDF] Multiple Linear Regression (MLR) Handouts
This handout continues with the housing price example, showing a real-world case of a coefficient changing signs.
On pages 19-20 of the PDF, review the section titled "What's Wrong?". It compares the coefficient for the number of bedrooms (BDR) in a simple regression versus a multiple regression. This is a perfect illustration of why the "holding others constant" clause is not optional.
From Theory to Practice: Interpreting R Output
Let's apply this to a full example. The following reading analyzes data on literacy rates, newspaper circulation, and radio/TV ownership.
[PDF] Lesson 21: Multiple Linear Regression Analysis
This guide from Oregon State University provides excellent, exam-ready phrasing for interpreting coefficients.
Please read the section "Interpretation of the coefficients in the multiple linear regression equation." Focus on the two alternative interpretations provided for the newspaper coefficient. Both are correct and illustrate the core concept well.
Let's use the output from that reading to interpret the coefficient for radios.
Output Snippet:
Predictor         Coef
...
radios       -0.0003535
...
Variable Definitions:
- Response: Literacy rate (proportion)
- Predictors:
newspaper copies,radios,television sets(all measured as units per 1000 people)
Your Task: Using our template, how would you interpret the coefficient for radios?
Solution
Exam-Style Interpretation:
A one-unit increase in the number of radios per 1000 people is associated with a 0.00035 decrease in the predicted literacy rate, holding the number of newspaper copies and television sets per 1000 people constant.
Practice Drill
You are given the following partial R output for a model predicting house price (in thousands of dollars).
Coefficients:
            Estimate
(Intercept) 565.300
House_Size    0.113  (in square feet)
Distance    -15.975  (in miles from city center)
Age           0.285  (in years)
Your Task:
- Write a precise, exam-style sentence interpreting the coefficient for
House_Size. - Write a precise, exam-style sentence interpreting the coefficient for
Distance.
Solution
-
House_Size Interpretation:
For each additional square foot of house size, the predicted price is associated with an increase of $113 (0.113 * 1000), holding the distance from the city center and the age of the house constant.
-
Distance Interpretation:
For each additional mile of distance from the city center, the predicted price is associated with a decrease of $15,975, holding the house size and age of the house constant.
Conclusion
This lesson introduced the single most important rule for interpreting coefficients in multiple linear regression. You learned that the effect of any one predictor is conditional on the other variables included in the model.
Key Takeaways:
- The interpretation of a coefficient in MLR is the expected change in for a one-unit change in , holding all other predictor variables constant.
- This "holding constant" clause is not optional; a variable's coefficient can change in both magnitude and sign when other variables are added or removed.
- For your exam, always use the phrase "is associated with" rather than "causes" to describe the relationship. The template is your friend:
A 1-unit change in X is associated with a B-unit change in Y, holding Z constant.
So far, we have only interpreted the value of the coefficients. We have not yet discussed whether these values are statistically meaningful or if they could have occurred by random chance. In the next lesson, we will do just that by learning to assess the statistical significance of individual predictors using their t-statistics and p-values.