Introduction
In our last lesson, we established the Net Present Value (NPV) rule as a powerful tool for making investment decisions. We saw that the cash flows used in these calculations are forecasts—or, in statistical terms, expected values. This naturally leads to a crucial question: if we have an expectation, what is the uncertainty or risk around that expectation?
This lesson directly addresses that question. We will delve into the other fundamental dimension of any investment: risk. Your background in statistics will be a significant asset here, as we will be applying familiar concepts like expected value, variance, and standard deviation to the domain of finance. By the end of this lesson, you will be able to calculate the expected return and standard deviation for a portfolio of assets. More importantly, you will understand how these calculations demonstrate the powerful principle of diversification and the fundamental risk-return relationship.
1. Calculating a Portfolio's Expected Return
Just as we calculated the expected value of a project's cash flows, we can calculate the expected return of a portfolio. A portfolio is simply a collection of individual assets, such as stocks and bonds. The expected return of a portfolio is the weighted average of the expected returns of the individual assets it contains.
The formula is quite intuitive, especially given your background:
Where:
- is the expected return of the portfolio.
- is the weight, or proportion, of the -th asset in the portfolio.
- is the expected return of the -th asset.
- The sum of all weights must equal 1 (i.e., ).
Sometimes, the expected return of an asset is given directly. Other times, we must first calculate it based on the asset's potential returns in different economic scenarios, each with a given probability. This is a classic expected value calculation.
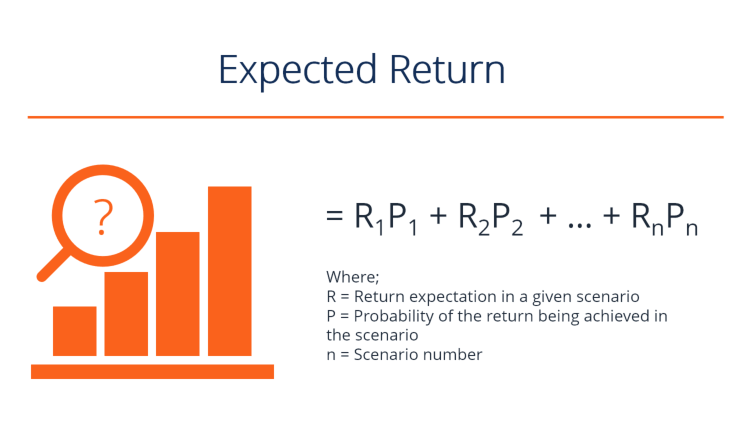
The following video provides clear, step-by-step examples of both of these situations.
Calculating Expected Portfolio Returns and Portfolio Variances
Please watch the first two examples from the video "Calculating Expected Portfolio Returns and Portfolio Variances" by FinanceKid.
First, watch the straightforward example from the beginning, where the expected returns of the individual stocks are already provided. This demonstrates the basic weighted-average calculation. Next, watch the more detailed example from the second part. Here, you must first calculate the expected return for each stock based on its performance in "boom" and "bust" economic states. This is a common problem format in finance exams.
As you can see, calculating the expected return of a portfolio is a direct application of the concept of a weighted average. The key is to ensure you have the correct expected return for each individual asset before combining them.
2. Measuring Portfolio Risk: Variance and Standard Deviation
Now we turn to risk, which in finance is most commonly measured by the variance or standard deviation of returns. A higher standard deviation implies greater volatility and therefore higher risk.
A critical point to understand is that portfolio variance is not simply a weighted average of the individual asset variances. This is because the returns of assets do not move in isolation; they are often correlated. This co-movement, measured by covariance or correlation, has a profound impact on the portfolio's overall risk.
The formula for the variance of a two-asset portfolio makes this clear:
Since covariance can be expressed in terms of correlation (), the formula is often written as:
Here, the third term, the covariance term, is what accounts for the diversification effect. A negative or low positive correlation () will reduce the total portfolio variance.
The following video explains the importance of this formula and the concept of diversification.
Diversification with Two Assets
Watch this segment from the video "Diversification with Two Assets" by Eric Kelley.
Focus on the explanation of the portfolio variance formula and the role of correlation from this section. The speaker does an excellent job of breaking down the formula and explaining why the correlation term is the mathematical engine of diversification.
A Practical Method for Calculating Portfolio Variance
While the formula above is essential for conceptual understanding, a more robust and often simpler method for exams involves using scenario analysis. This approach neatly sidesteps the need to calculate all the individual covariances.
The logic is as follows:
- For each economic scenario, calculate the portfolio's overall return using the weighted-average method we learned in the first section.
- You now have a new random variable: the portfolio return, with a set of possible outcomes and associated probabilities.
- Calculate the variance of this new random variable using the standard statistical formula for the variance of a discrete random variable.
The same "FinanceKid" video you watched earlier demonstrates this technique perfectly. It first reminds you of the five-step process for finding the variance of a single stock from scenarios, and then cleverly applies the exact same process to the portfolio as a whole.
Calculating Expected Portfolio Returns and Portfolio Variances
Please return to the "Calculating Expected Portfolio Returns and Portfolio Variances" video.
First, watch the section on calculating the variance of a single stock from this clip. This establishes the five-step procedure: find expected return, calculate deviations, square deviations, multiply by probabilities, and sum the results. Now, watch the crucial segment on calculating portfolio variance from the next section. Pay close attention to the key insight: instead of trying to combine individual stock variances, you first calculate the portfolio's return in each state ("boom" and "bust"). Then, you treat the portfolio as a single asset and apply the same five-step variance calculation you just learned.
Once you have the portfolio variance (), the portfolio standard deviation () is simply its square root.
3. Visualizing Diversification
The calculations we've performed reveal the power of diversification. By combining assets that are not perfectly positively correlated, we can create a portfolio with a lower standard deviation than the weighted average of the individual assets' standard deviations.
This effect is often visualized by plotting expected return against standard deviation (risk).
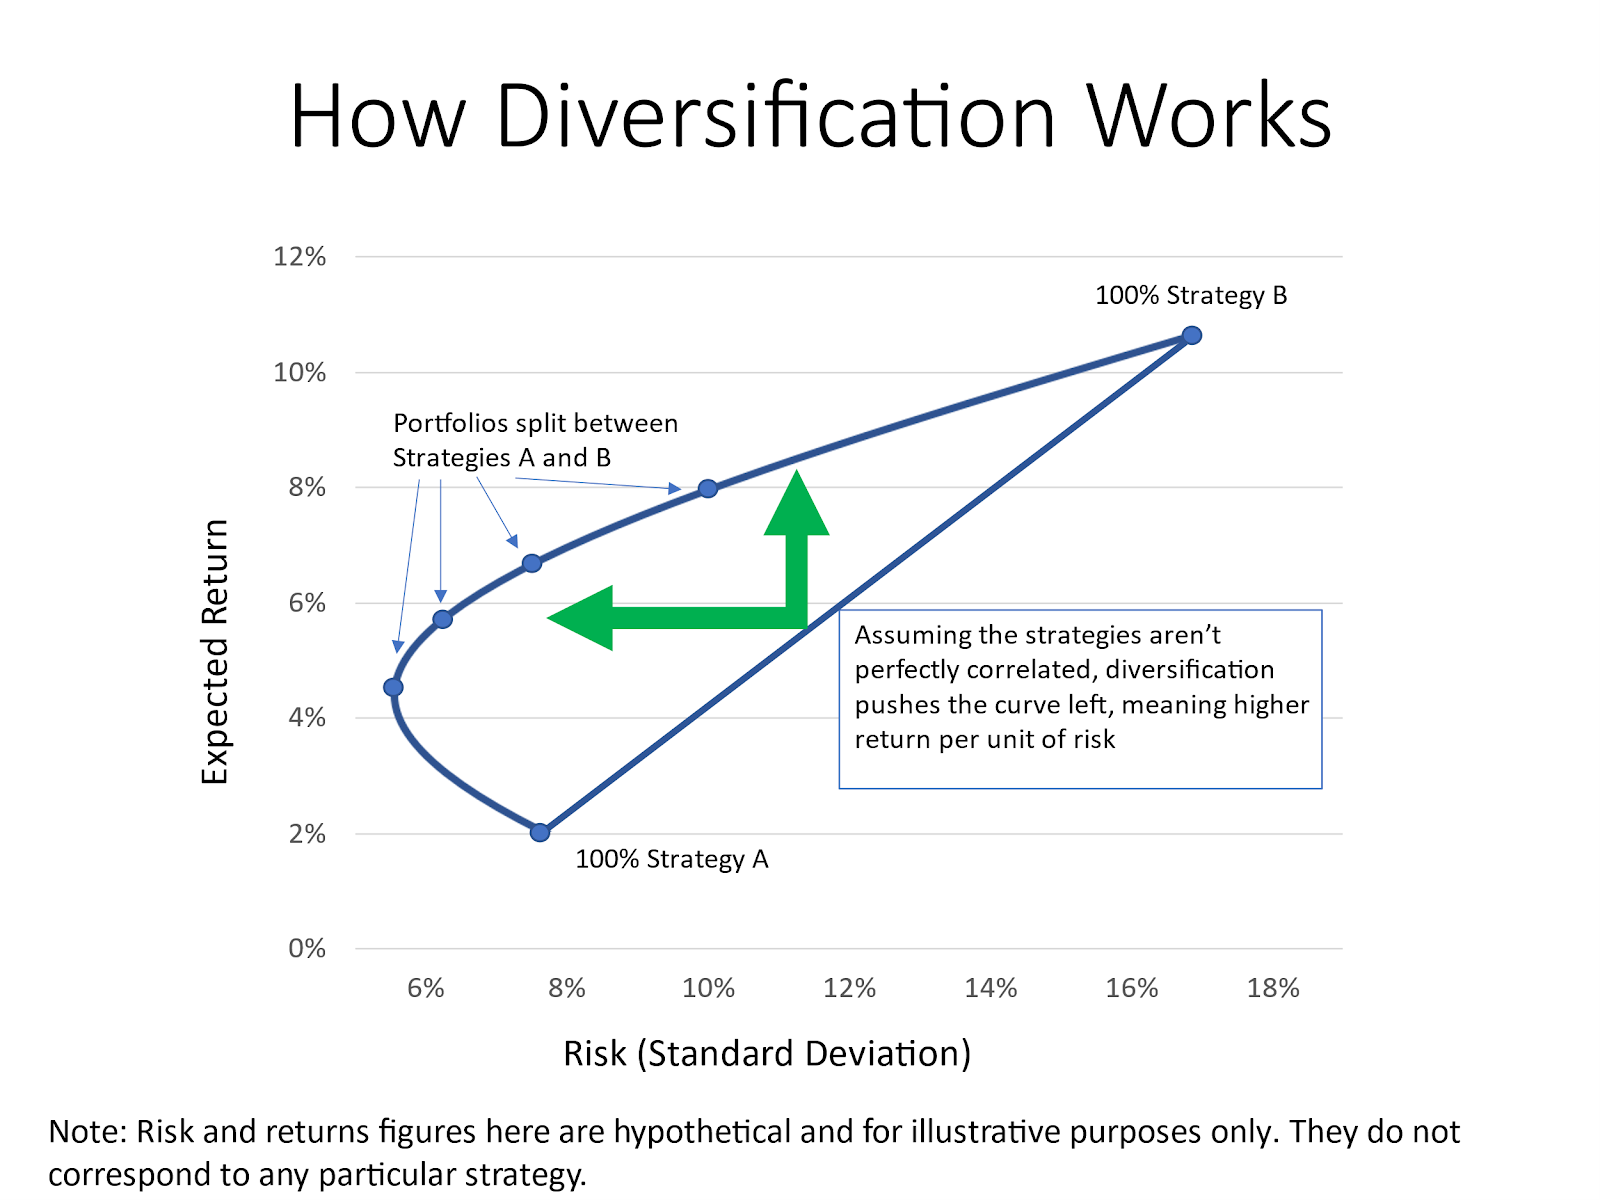
As the image shows, if two assets (Strategy A and Strategy B) are imperfectly correlated, you can form portfolios (the dots on the curve) that offer a better risk-return profile than a simple linear combination. For example, a portfolio might have the same risk as Strategy A alone, but a much higher expected return. This "free lunch" of risk reduction is the core benefit of diversification. The lower the correlation between the assets, the more the curve will bend to the left, offering greater diversification benefits.
Conclusion
In this lesson, we have quantified the two primary dimensions of an investment: return and risk. We leveraged your statistical knowledge to apply the concepts of expected value and standard deviation to financial portfolios.
Key Takeaways:
- Portfolio Expected Return is the weighted average of the expected returns of its component assets.
- Portfolio Risk (standard deviation) depends not only on the individual asset risks but crucially on the correlation between them.
- The formula for portfolio variance includes a covariance term that captures the effects of assets' co-movements.
- Diversification is the process of reducing portfolio risk by combining assets with low or negative correlation. This allows for a more favorable risk-return profile.
- For scenario-based problems, the most effective way to calculate portfolio variance is to first determine the portfolio's return in each scenario and then compute the variance of those portfolio returns.
We have now established how to measure the expected return and risk of an investment. In our next lesson, we will explore the Efficient Market Hypothesis, a cornerstone theory in finance that discusses how quickly and fully information, including information about risk and return, is reflected in asset prices.