Introduction
Welcome to the final lesson in our module on interpreting accounts. In our previous lesson, we explored horizontal and vertical analysis, which allow us to see how a company's financial structure evolves over time. Today, we will integrate those dynamic perspectives with the full spectrum of financial ratios you've learned to conduct a comprehensive performance evaluation. This lesson is designed to mirror a key task in the CB1 exam: not just calculating ratios, but weaving them into a coherent analysis and, crucially, understanding the boundaries of what they can tell us.
Our objective is twofold: first, to apply a wide range of ratios to a set of financial statements to build a holistic picture of a company's health. Second, we will critically evaluate the inherent limitations of this analytical method. Your background in statistics will be particularly useful here, as we discuss how ratios, much like statistical summaries, can sometimes obscure as much as they reveal if not handled with care and context.
By the end of this lesson, you will be equipped to move from being a calculator of financial metrics to a critical interpreter of a company's financial story.
1. A Comprehensive Framework for Analysis
Ratio analysis provides a structured way to investigate a company's performance from multiple angles. Typically, these investigations are grouped into categories, each answering a different fundamental question about the business. The diagram below shows the five common categories we will use to structure our analysis: Liquidity, Profitability, Solvency, Turnover, and Earnings.
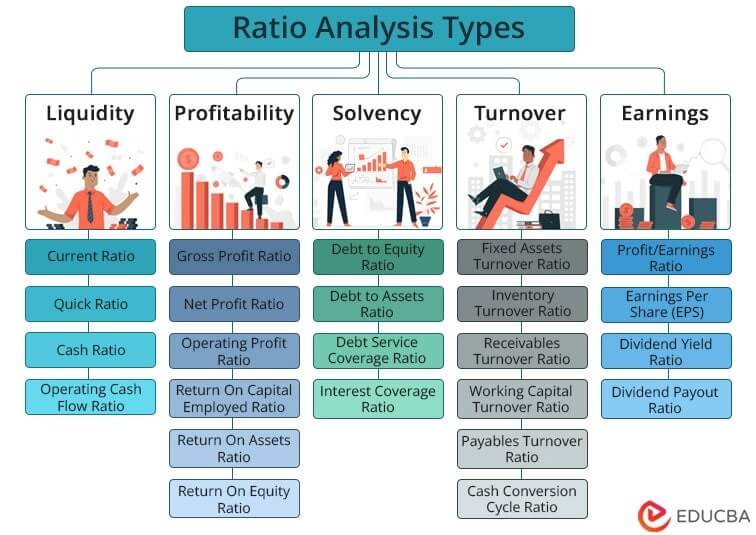
Each category provides a different lens:
- Liquidity: Can the company meet its short-term bills?
- Profitability: Is the company generating sufficient profit from its sales and assets?
- Solvency (or Gearing): What is the company's long-term risk profile, particularly concerning its debt levels?
- Turnover (or Efficiency): How efficiently is the company using its assets to generate sales?
- Earnings (or Investor): How is the company performing from the perspective of a shareholder?
A thorough analysis involves calculating key ratios from each category and looking for corroborating or conflicting signals between them.
2. Applying the Framework: A Worked Example
The best way to understand the power of this framework is to see it in action. We are now going to walk through a detailed case study where an analyst calculates and interprets a full suite of ratios for a company over two years. This will bring together the individual ratios you've learned in previous lessons into a single, cohesive analysis.
Your preference for practical, numerical examples will be well-served here. The following video is an extended walkthrough that demonstrates not only the calculations but also the thought process of comparing results year-on-year and deciding whether performance is "better" or "worse."
FA 52 - Financial Ratio Calculations and Analysis
This video, "FA 52 - Financial Ratio Calculations and Analysis" by Tony Bell, is an excellent, in-depth worked example of a comprehensive ratio analysis. The instructor methodically computes and interprets ratios from all five categories for a company over a two-year period.
This is a comprehensive video, so I suggest watching it in stages, focusing on one category of ratios at a time. The instructor's commentary on what makes a ratio "better" or "worse" and how the different ratios create a "mixed bag" of results is particularly important. Introduction & Liquidity Ratios: Watch from the start to understand the problem setup, then continue through the calculation of the current and acid-test ratios (the first section). Turnover (Efficiency) Ratios: Continue with the analysis of inventory and accounts receivable turnover (the second section). Solvency (Debt) Ratios: Next, watch the section on the debt ratio and times interest earned (the third section). Profitability Ratios: Follow the calculations for gross profit, return on sales, return on assets, and return on equity (the fourth section). Earnings & Investor Ratios: Watch the analysis of EPS, P/E ratio, and dividend yield (the fifth section). Overall Summary: Finally, listen to the instructor's concluding summary, where he synthesizes the findings into an overall evaluation (the conclusion).
As you can see from the video, a robust analysis rarely yields a simple "good" or "bad" verdict. More often, it reveals a complex picture of strengths in some areas (like profitability) and weaknesses in others (like efficiency). The skill lies in interpreting this mixed evidence to form a balanced judgment.
3. A Critical Evaluation of Ratio Analysis
While ratio analysis is an indispensable tool, it is fraught with potential pitfalls. A competent analyst must be acutely aware of its limitations to avoid drawing simplistic or incorrect conclusions. Simply calculating the numbers is insufficient; the CB1 exam will expect you to discuss the context and caveats.

The following reading delves into these limitations in more detail.
Financial Ratios: In-Depth Explanation with Examples
This text from AccountingCoach provides a clear and concise summary of the benefits and, more importantly, the limitations of using financial ratios.
Please read the two sections on limitations. First, focus on the initial overview provided in the introduction. Then, for a more detailed breakdown, read the dedicated section titled Benefits and Limitations.
To build on this, let's synthesize the key limitations an analyst must always consider:
- Reliance on Historical Data: Ratios are based on past performance and are not necessarily predictive of the future. A company with great ratios could be on the verge of a product becoming obsolete.
- Lack of Comparability:
- Across Industries: Comparing the inventory turnover of a supermarket with that of a heavy machinery manufacturer is meaningless due to vastly different business models.
- Within Industries: Different accounting policies (e.g., LIFO vs. FIFO for inventory; straight-line vs. reducing balance for depreciation) can significantly distort comparisons even between direct competitors.
- The Problem of Averages: Many ratios, like inventory days or receivable days, are averages. You'll recognize from statistics that an average can conceal a problematic distribution. A company might have a healthy average collection period of 35 days, but this could be masking a large number of customers who pay in 15 days and a significant, risky cluster of debtors who are over 90 days past due.
- Qualitative Factors Ignored: Ratios are purely quantitative. They tell you nothing about the quality of management, brand reputation, employee morale, customer satisfaction, or the competitive landscape—all of which are critical to a company's long-term success.
- Potential for Manipulation ("Window Dressing"): Companies can sometimes time transactions around the year-end to make their balance sheets—and thus their liquidity or gearing ratios—look more favorable than they are throughout the year.
- Inflationary Distortion: Financial statements are typically based on historical cost. During periods of high inflation, comparing ratios over several years can be misleading as the underlying asset and profit figures are not stated in constant monetary terms.
The crucial takeaway is that ratio analysis is the beginning of an investigation, not the end. The ratios provide questions, not answers. A falling profit margin prompts the question "Why?"; it doesn't automatically mean the company is failing. This emphasis on interpretation is vital.
INTERPRETATION OF FINANCIAL STATEMENTS (ACCOUNTING RATIOS) - PART 1
In this video, "INTERPRETATION OF FINANCIAL STATEMENTS," the presenter strongly emphasizes the importance of interpretation.
Please watch the segment from this section. The key message is that as you advance in your studies and career, the focus shifts dramatically from calculation to interpretation and report writing. Examiners are looking for your ability to analyze, not just compute.
Conclusion
This lesson completes our exploration of interpreting accounts. We have brought together all the ratio types into a single analytical framework, applied it to a practical example, and, most importantly, have critically assessed the limitations of the entire approach.
Key Takeaways:
- Comprehensive Analysis: A thorough evaluation of a company requires calculating and interpreting a suite of ratios across five key areas: liquidity, solvency, efficiency, profitability, and investor metrics.
- Context is King: A ratio is meaningless in isolation. Its value comes from comparison—against the company's own history (horizontal analysis), against industry benchmarks, and against other ratios that might tell a conflicting story.
- Ratios Ask Questions: Ratio analysis is a diagnostic tool. A "bad" ratio is a symptom that prompts further investigation into the underlying operational or financial causes.
- Awareness of Limitations: A skilled analyst must always qualify their conclusions by acknowledging the limitations of ratio analysis, including its reliance on historical data, its blindness to qualitative factors, and its vulnerability to accounting policy differences and manipulation.
You have now completed the module on interpreting financial statements. This is a cornerstone of the CB1 syllabus. In our next lesson, we will venture into a new and exciting area: Financial Derivatives. We will begin by exploring the mechanics of forward and futures contracts and how they are used to manage financial risk.