Introduction
In our previous lessons, we've built a comprehensive toolkit for calculating individual financial ratios, covering everything from profitability and liquidity to the investor-focused metrics we explored last time. While these ratios provide valuable snapshots of a company's health at a single point in time, their true power is unlocked when we observe how they change. This lesson introduces two fundamental techniques that allow us to analyze financial statements dynamically: horizontal analysis and vertical analysis.
Today, we will learn how to perform these analyses to assess a company's performance over time and understand its internal financial structure. This directly addresses the learning outcome of performing trend and common-size analysis. For you, with your background in statistics, these methods will feel familiar. They are essentially ways to standardize financial data—either over time or relative to a base—to make meaningful comparisons, much like creating index numbers or calculating proportions to compare different datasets.
By the end of this lesson, you will be able to transform a static set of financial statements into a dynamic story of a company's evolution and operational makeup.
1. Horizontal Analysis: Tracking Performance Across Time
Horizontal analysis, also known as trend analysis, involves comparing financial information from a company across two or more reporting periods. The goal is to identify the direction and magnitude of change in specific line items like sales, expenses, or profit. This is done by laying out the financial statements side-by-side and calculating the change from one period to the next, both in absolute currency terms and as a percentage.
The formula for the percentage change between two consecutive periods is:
This technique is invaluable for spotting significant shifts in performance. For instance, have costs grown faster than revenues? Has the company's net income accelerated or slowed down? Let's begin by watching a practical demonstration of how this is done.
How to Analyze Financial Statements For a Corporation. 4 Types of Financial Analyses
In this video, "How to Analyze Financial Statements," the presenter from The Financial Controller provides a clear, practical walkthrough of setting up and interpreting a horizontal analysis in Excel.
Please watch the section from the detailed explanation of horizontal analysis. Pay attention to how he compares three months of data, calculates the change and percentage change, and uses this information to investigate variances. He makes a key point: the purpose is not just to report numbers but to find mistakes or areas that need further explanation.
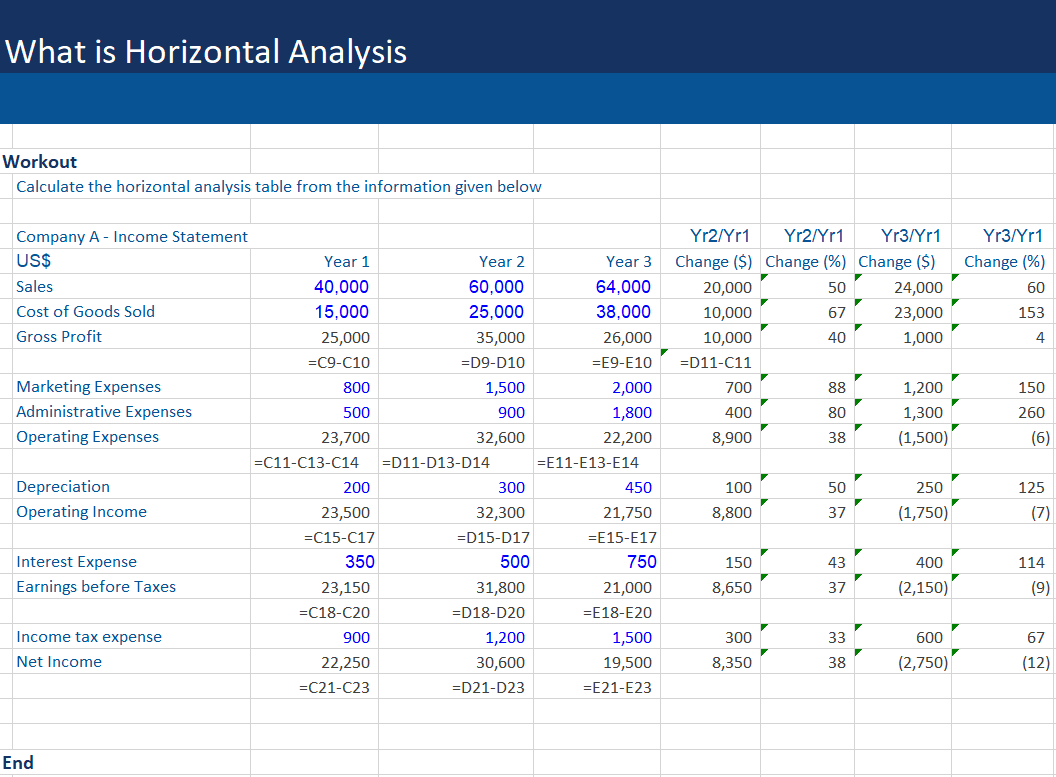
The output of such an analysis is typically a table that clearly lays out the changes. The image below shows a completed horizontal analysis of an income statement over three years, illustrating both the change in dollar amount and the percentage change.
Trend Analysis with a Base Year
A more formal type of horizontal analysis involves choosing a base year and expressing all subsequent years' figures as a percentage of the base year's amount. This is very similar to creating an index in statistics, where the base year is set to 100.
The formula is:
This method is excellent for visualizing long-term trends over several years. A trend percentage greater than 100 indicates growth relative to the base year, while a value less than 100 indicates a decline.
The following video provides a step-by-step numerical example of this calculation.
[#5] Trend Analysis | Financial Statement Analysis | Solved Problem | Techniques of Analysis
This video, "[#5] Trend Analysis" from Kauserwise Accounting Class, focuses exclusively on how to calculate trend percentages using a base year.
First, watch the brief introduction from the definition to understand the formula. Then, follow the detailed worked problem from the calculation walkthrough. Note how the base year (2018) is set to 100% for all items, and all other years are calculated relative to it.
2. Vertical Analysis: Understanding Financial Structure
While horizontal analysis looks across time, vertical analysis, also called common-size analysis, looks up and down a single financial statement for one period. It involves expressing each line item as a percentage of a significant total or base figure from the same statement.
- For an Income Statement, each item (e.g., Cost of Goods Sold, Operating Expenses, Net Income) is stated as a percentage of Net Sales.
- For a Balance Sheet, each item (e.g., Cash, Inventory, Debt) is stated as a percentage of Total Assets.
This technique removes the effect of a company's size, allowing for easy comparison of its financial structure over time or against different companies, even if one is a giant and the other is a small competitor. It answers questions like: "What percentage of our revenue is eaten up by material costs?" or "What percentage of our assets is financed by debt?"
Let's see this in action.
How to Analyze Financial Statements For a Corporation. 4 Types of Financial Analyses
We return to The Financial Controller's video, which now explains vertical analysis.
Watch the segment from the explanation of vertical analysis. The presenter shows how to calculate each income statement item as a percentage of revenue and uses this to identify positive trends (costs decreasing as a % of revenue) and red flags (costs increasing as a % of revenue).
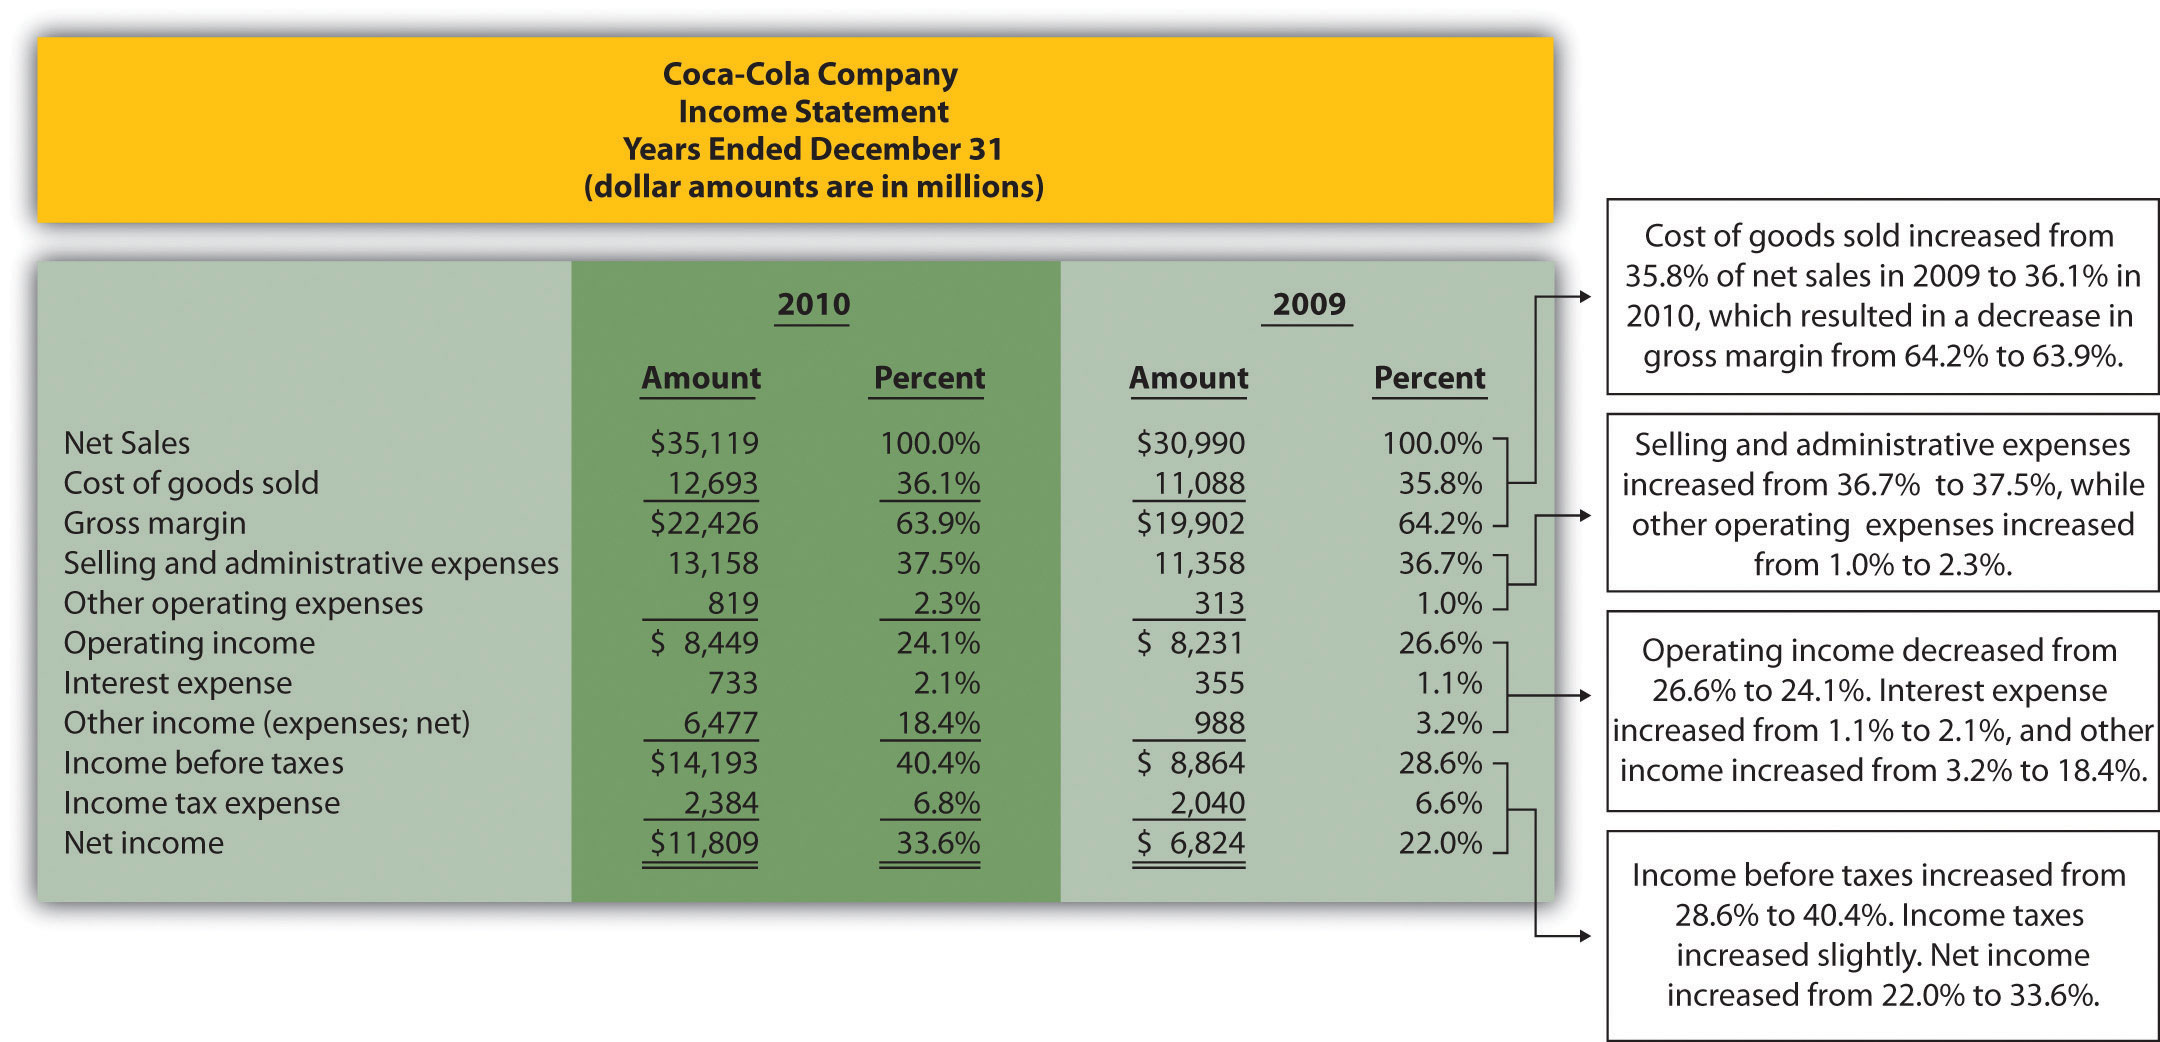
A common-size income statement provides immediate insights into a company's profitability and cost control. The example below for The Coca-Cola Company shows each line item as a percentage of Net Sales for two consecutive years, with callouts explaining the key changes.
To solidify your understanding of both horizontal and vertical analysis, the following reading provides detailed definitions and worked examples for each.
Horizontal, Common-Size and Trend Analysis
This article from Taxmann provides clear explanations and illustrations for the techniques we've discussed.
First, read the section on Horizontal Analysis, focusing on the example of MegaNuts Limited. Pay attention to the interpretation, which notes that sales increased less than manufacturing costs, signaling pressure on profits. Next, read the section on Common-size Analysis. Observe how converting the MegaNuts statements into common-size format reveals that manufacturing expenses grew as a percentage of sales, which explains the declining profit margin.
Conclusion
In this lesson, we have moved beyond calculating static ratios to applying dynamic analysis techniques. By mastering horizontal and vertical analysis, you can now dissect financial statements to reveal trends, structural changes, and potential areas of concern that a single-period view might miss.
Key Takeaways:
- Horizontal Analysis (Trend Analysis) compares financial data across time, either by calculating period-over-period percentage changes or by expressing data as a percentage of a base year. It is used to identify growth patterns and performance trends.
- Vertical Analysis (Common-Size Analysis) expresses each line item as a percentage of a base figure within a single period (e.g., sales for the income statement, assets for the balance sheet). It is used to understand a company's internal structure and to compare companies of different sizes.
- These two methods are most powerful when used together to build a comprehensive narrative about a company's financial story.
In our next and final lesson of this module, we will bring everything together. You will apply the full range of ratio calculations, along with the trend and common-size analyses you've learned today, to a complete set of financial statements. We will also critically discuss the inherent limitations of ratio analysis, preparing you to provide a balanced and insightful evaluation of a company's performance, as required in the CB1 exam.