Introduction
Welcome to the next lesson in our journey through financial statement analysis. In our previous sessions, we've explored a company's performance from various angles: profitability, liquidity, solvency, and operational efficiency. Now, we turn our attention to a set of metrics that are of paramount importance to the owners of a company—the shareholders. This lesson focuses on investor ratios, which are crucial for assessing the return on an investment and the market's perception of a company's value.
This topic directly addresses the learning outcome of calculating and interpreting key investor ratios, specifically Earnings Per Share (EPS), the Price/Earnings (P/E) ratio, and Dividend Yield. We will also explore the Dividend Cover ratio, a vital measure of dividend sustainability. Mastering these ratios is essential for your CB1 exam, as they frequently appear in questions that test your ability to evaluate a company from an investor's standpoint.
1. Earnings Per Share (EPS): The Shareholder's Slice of Profit
The most fundamental question for a shareholder is: "How much profit is the company making for my single share?" Earnings Per Share (EPS) answers this directly. It represents the portion of a company's net profit that is allocated to each outstanding share of common stock. It is a cornerstone of valuation and is often reported in financial headlines.
The formula for EPS is:
It's important to subtract preferred dividends because those dividends are paid out to preference shareholders before any profit is available to common shareholders.
To begin, let's watch a concise explanation of what EPS represents.
FINANCIAL RATIOS: How to Analyze Financial Statements
This clip from the "FINANCIAL RATIOS" video by Accounting Stuff clearly defines Earnings per Share and its calculation.
Please watch the segment from this explanation of EPS. Note the emphasis on profit allocation and why preferred dividends are sometimes deducted.
Now that we have the concept down, let's see how it's applied in practice with a worked example. This will be more aligned with the kind of numerical problem you'll encounter in the exam.
FA 52 - Financial Ratio Calculations and Analysis
In this segment from "FA 52 - Financial Ratio Calculations and Analysis," Professor Tony Bell calculates and interprets EPS for a company over two years.
Watch from the EPS calculation. Pay close attention to how he identifies the numerator (Net Income - Preferred Dividends) and the denominator (Number of common shares) from the provided financial data. Observe his conclusion that "bigger is better" for this ratio.
As you can see, a higher EPS is generally more attractive, as it indicates greater profitability on a per-share basis. This figure is the "E" in the P/E ratio, which we'll discuss next.
2. Price/Earnings (P/E) Ratio: A Measure of Market Expectation
While EPS tells us about a company's profitability, the Price/Earnings (P/E) Ratio tells us how the stock market values that profitability. It compares the company's current share price to its earnings per share.
The formula is straightforward:
In essence, the P/E ratio indicates how much investors are willing to pay for each dollar of a company's earnings. A high P/E ratio might suggest that investors expect strong future growth, while a low P/E ratio could indicate lower growth expectations or that the stock is undervalued.
Let's start with a quick conceptual overview.
FINANCIAL RATIOS: How to Analyze Financial Statements
The Accounting Stuff video provides a succinct explanation of the P/E ratio and its meaning.
Please watch from this overview of the P/E ratio. Focus on the idea that it measures what the market is "prepared to pay for each dollar of earnings."
With that concept in mind, let's return to our worked example to see the P/E ratio in action. The interpretation is key here.
FA 52 - Financial Ratio Calculations and Analysis
Professor Bell now calculates the P/E ratio using the EPS figures we just saw. His interpretation is particularly valuable.
Watch the segment from this P/E ratio calculation. Notice his explanation of why a company like Tesla might have a high P/E ratio—it reflects the market's confidence in future growth, not just current earnings. He also makes an important point: a high P/E is good for existing owners but might signal an overpriced stock to potential new investors.
3. Dividend-Based Ratios: The Cash Return
While earnings are important, many investors are primarily interested in the actual cash they receive from their investment. This is where dividend-based ratios come in.
Dividends Per Share (DPS) and Dividend Yield
First, we need to know the Dividends Per Share (DPS), which is the total dividend paid out to common shareholders on a per-share basis.
Once we have the DPS, we can calculate the Dividend Yield. This ratio expresses the annual dividend as a percentage of the stock's current market price, effectively showing the dividend-only return on investment.
For an investor focused on generating income, a higher dividend yield is generally more attractive.
The following video segments will walk you through both DPS and Dividend Yield.
FINANCIAL RATIOS: How to Analyze Financial Statements
This video introduces both DPS and Dividend Yield clearly and concisely.
First, watch the section on Dividends Per Share (DPS). Then, continue with the section on the Dividend Yield Ratio.
Now, let's see the Dividend Yield calculated in our ongoing example.
FA 52 - Financial Ratio Calculations and Analysis
Professor Bell calculates the dividend yield for the company in his example.
Watch this final segment from the dividend yield calculation. Notice his interesting observation: even though the DPS increased from $1 to $2, the dividend yield decreased from 2% to 1.33%. This is because the share price tripled, a crucial insight into how these ratios interact.
To consolidate what we've covered on these core investor ratios, the following guide provides a useful summary of the formulas.
A guide to the financial accounting area of study
This guide from OCR offers a clear, "at-a-glance" summary of the key shareholder ratios.
Please review the section on Shareholder ratios. You'll find the formulas and brief interpretations for Dividend per share (DPS), Dividend yield, Earnings per share (EPS), and the Price/earnings ratio.
4. Dividend Cover: Assessing Dividend Safety
A high dividend yield is attractive, but it's only meaningful if the company can afford to maintain its dividend payments. The Dividend Cover ratio (also called the Dividend Coverage Ratio or DCR) measures exactly this: the company's ability to pay its declared dividends out of its profits.
It tells you how many times the company's earnings could pay for the current dividend.
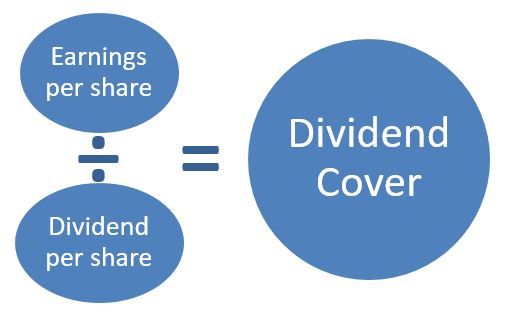
The formula is:
A ratio below 1 is a major red flag, as it means the company is paying out more in dividends than it's earning, possibly by dipping into its cash reserves—an unsustainable practice. A ratio between 1 and 2 is common but may indicate some risk if earnings fall. A ratio above 2 is generally considered safe, suggesting a strong cushion.
Let's delve deeper into this important metric with a reading that provides detailed explanations and numerical examples.
Dividend Coverage Ratio - Formula, Examples, and Guide to DCR
This article from Wall Street Oasis gives a thorough breakdown of the Dividend Cover ratio.
Please read the following sections: Start with the introduction to understand its purpose. Next, read the interpretation guide. This is crucial for understanding what different values of the ratio signify (e.g., DCR < 1 vs. DCR > 2). Then, review the formulas. Note that it can be calculated using either total figures (Net Income / Dividends) or per-share figures (EPS / DPS). Finally, work through the numerical examples. Comparing Company LYC (low cover) with TYL (high cover) is an excellent way to see the practical implications.
Using the figures from Professor Bell's video, we can calculate the dividend cover for his example company:
- 2024: Dividend Cover = $3.90 (EPS) / $2.00 (DPS) = 1.95 times
- 2023: Dividend Cover = $1.80 (EPS) / $1.00 (DPS) = 1.80 times
The dividend is just about covered by earnings, but it's below the comfortable safety margin of 2. This suggests that while the dividend payment is manageable, there isn't a large buffer if the company's profits were to decline.
Conclusion
In this lesson, we have focused on the key ratios that directly concern shareholders and potential investors. These metrics provide critical insights into a company's value, return potential, and risk profile.
Key Takeaways:
- Earnings Per Share (EPS) is the bottom-line measure of profit attributable to each common share.
- The Price/Earnings (P/E) Ratio is a valuation metric that reflects the market's expectations for a company's future growth.
- Dividend Yield measures the cash return an investor receives from dividends relative to the stock's price.
- Dividend Cover assesses the safety and sustainability of dividend payments by comparing earnings to the dividends paid out.
We have now calculated a wide range of ratios covering profitability, liquidity, solvency, efficiency, and investor perspectives. In our next lesson, we will tie all of this together by learning how to perform trend analysis and common-size analysis. These techniques will allow you to systematically use these ratios to evaluate a company's performance over time and against its competitors, and to understand the limitations of ratio analysis.