Introduction
Welcome to our new module, "Financial Derivatives for Hedging." In the previous module, we focused on interpreting a company's past performance by analysing its financial statements. We now shift our perspective from looking backward to looking forward. This module is about the tools companies use to manage future financial risks. These tools are called derivatives, as their value is derived from the value of an underlying asset, such as a share, a commodity, or a currency.
In this first lesson, we will explore the most fundamental types of derivatives: forward and futures contracts. Our goal is to understand how these contracts work and, crucially, how to represent their financial outcomes visually. Your background in statistics will be helpful here, as we can think of the future asset price as a random variable, and the payoff diagram as a function that maps the realized value of that variable to a specific profit or loss.
By the end of this lesson, you will be able to construct and interpret the payoff diagrams for both long and short positions in forward and futures contracts, a foundational skill for understanding how derivatives are used in business finance.
1. Understanding Forward Contracts
A forward contract is a simple, private agreement between two parties to buy or sell an asset at a specified future date for a price agreed upon today. These contracts are typically created "over-the-counter" (OTC), meaning they are bespoke agreements not traded on a formal exchange.
Let's break down the key terms:
- Underlying Asset: The item to be delivered (e.g., shares of a company, barrels of oil, ounces of gold).
- Delivery Date (or Maturity): The future date, , when the exchange will happen.
- Forward Price (or Delivery Price): The price, , that the buyer will pay and the seller will receive. This price is fixed when the contract is initiated.
- Long Position: The party who agrees to buy the underlying asset.
- Short Position: The party who agrees to sell the underlying asset.
A critical feature of a forward contract is that it represents an obligation for both parties. Unlike an option, where one party has a choice, here both the buyer and seller are locked into the transaction.
The video below provides a clear definition of a forward contract and introduces the long and short positions using a practical example.
Forward Contracts Explained: How-To Value Them
This video, "Forward Contracts Explained," clearly defines the instrument and its key terminology.
Please watch the first two minutes (the introduction). Focus on understanding the roles of the long and short parties and the nature of their agreement.
2. Payoff Diagrams for Forward Contracts
The "payoff" of a forward contract is the profit or loss to a position at the maturity date. It depends entirely on the relationship between the asset's market price at maturity (the "spot price," denoted ) and the agreed-upon forward price, .
The Long Position Payoff
For the party in the long position (the buyer), the payoff is calculated as:
If the spot price at maturity, , is higher than the price they are obligated to pay, , they make a profit. They can buy the asset for and it is worth . Conversely, if the spot price is lower than , they incur a loss.
We can visualize this relationship with a payoff diagram. The x-axis represents the possible spot prices of the underlying asset at maturity (), and the y-axis represents the payoff.
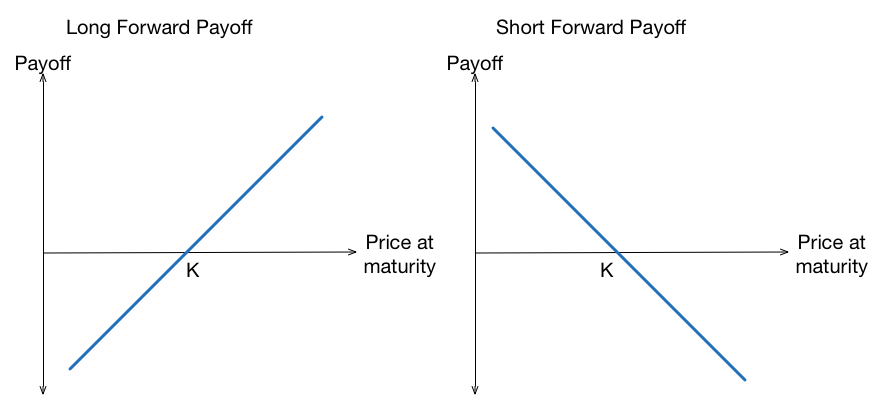
As you can see in the "Long Forward Payoff" diagram on the left, the payoff is:
- Positive if
- Zero if (the break-even point)
- Negative if
The payoff is a linear function with a slope of +1. This implies that for every dollar the spot price increases above , the long position's profit increases by one dollar. The potential for both profit and loss is, in theory, unlimited.
The Short Position Payoff
For the party in the short position (the seller), the situation is reversed. Their payoff is:
The short position profits if the spot price at maturity, , is lower than the price they are due to receive, . They are obligated to sell the asset for , even if its market value is less.
The "Short Forward Payoff" diagram on the right shows this mirror image. The payoff line has a slope of -1. The short position has unlimited profit potential if the asset price falls and unlimited loss potential if it rises.
Notice that for any given , the gain to one party is exactly equal to the loss of the other. This is known as a zero-sum game.
The following video segment walks through the construction and logic of these exact payoff diagrams.
Forward Contracts Explained: How-To Value Them
The second part of the "Forward Contracts Explained" video details the construction of the payoff diagrams we just discussed.
Please watch from this section, which explains the payoff formulas and diagrams for both the long and short positions. Pay close attention to how the profit or loss is determined relative to the forward price.
3. Introducing Futures Contracts
Futures contracts are very similar to forward contracts: they are also agreements to buy or sell an asset at a future date for a predetermined price. However, there are a few key institutional differences.
[PDF] Introduction to Futures and Forwards - Kellogg
This document from Kellogg School of Management provides a concise definition of futures and their distinguishing features.
Please read the section titled Futures. This section defines a future as an exchange-traded forward contract and highlights the three main differences: standardization, margin requirements, and marking-to-market.
The most important takeaways are that futures are:
- Standardized: They have pre-set contract sizes and delivery dates.
- Exchange-Traded: They are not private agreements but are traded on organized exchanges (like the CME Group or ICE). This increases liquidity and reduces counterparty risk.
- Marked-to-Market: Gains and losses are settled daily through a margin account system.
While the daily marking-to-market process is a crucial difference in practice, for the purpose of understanding the contract's outcome at expiration, the payoff structure is identical to that of a forward contract.
4. Payoff Diagrams for Futures Contracts
Because the fundamental obligation at maturity is the same, the payoff diagrams for futures contracts are identical to those for forwards. The investor's entry price is the futures price at which they entered the contract, and the payoff depends on the final price at expiration.

The following video explicitly makes this important connection.
Financial Futures Payoff Diagrams
This video, "Financial Futures Payoff Diagrams" by Patrick Boyle, directly compares the payoff profiles of underlying assets, forwards, and futures.
Please watch the short segment from this part of the video. The key point is that the payoff profiles for futures and forwards are identical.
5. A Numerical Example
Let's solidify this with a numerical example, as requested in your preferences. This example is adapted from the "Introduction to Futures and Forwards" reading.
Scenario: On September 10, two parties enter into a forward contract for the delivery of 100 ounces of gold on December 1 at a forward price () of $450 per ounce.
- The Long Position: Agrees to buy 100 oz of gold for $450/oz on Dec 1.
- The Short Position: Agrees to sell 100 oz of gold for $450/oz on Dec 1.
Case 1: Price Increases
Suppose on December 1, the spot price of gold () is $460 per ounce.
- Long Payoff:
- Interpretation: The buyer gets to purchase gold worth $46,000 for only $45,000, resulting in a $1,000 gain.
- Short Payoff:
- Interpretation: The seller must sell gold worth $46,000 for only $45,000, resulting in a $1,000 loss.
Case 2: Price Decreases
Suppose on December 1, the spot price of gold () is $430 per ounce.
- Long Payoff:
- Interpretation: The buyer is forced to purchase gold for $45,000 when it is only worth $43,000, resulting in a $2,000 loss.
- Short Payoff:
- Interpretation: The seller gets to sell gold for $45,000 when it is only worth $43,000, resulting in a $2,000 gain.
These calculations directly map onto the payoff diagrams we have been studying.
Conclusion
In this lesson, we have taken our first step into the world of financial derivatives. We established the fundamental mechanics of forward and futures contracts and, most importantly, visualized their financial outcomes.
Key Takeaways:
- A forward or futures contract is an obligation for two parties (long and short) to transact an asset at a future date for a price agreed upon today.
- The long position profits from a price increase, with a payoff of .
- The short position profits from a price decrease, with a payoff of .
- The payoff diagrams for both contracts are linear, illustrating unlimited potential for profit and loss in a zero-sum game.
- Despite institutional differences like standardization and marking-to-market, the payoff diagrams for futures and forwards are identical at expiration.
We have started with linear payoffs, which are relatively straightforward. In our next lesson, we will explore a different class of derivatives—options—where the payoff is non-linear. This will introduce asymmetry into the risk and reward profile, a concept we will analyze by constructing and interpreting payoff diagrams for call and put options.