Introduction
In our last lesson, we visually mapped the financial outcomes of forward and futures contracts using payoff diagrams. We established the core formulas for calculating the payoff per unit of an asset at maturity: for a long position and for a short position. Today, we will bring those diagrams to life by applying these formulas to concrete numerical examples, which aligns perfectly with your preference for practical, calculation-based learning.
Our goal is to master the calculation of the total profit or loss on a given forward or futures position. This involves moving beyond the per-unit payoff to account for the size of the contract. For futures, we will also incorporate specific market conventions like contract size and tick values. While the future spot price, , is a random variable whose behaviour could be described using probability theory, our focus here will be on the deterministic calculation of profit or loss for any given realization of that price.
1. From Payoff per Unit to Total Profit and Loss
As we saw, the payoff from a single unit of the underlying asset is determined by the difference between the spot price at maturity, , and the agreed-upon forward or futures price, .
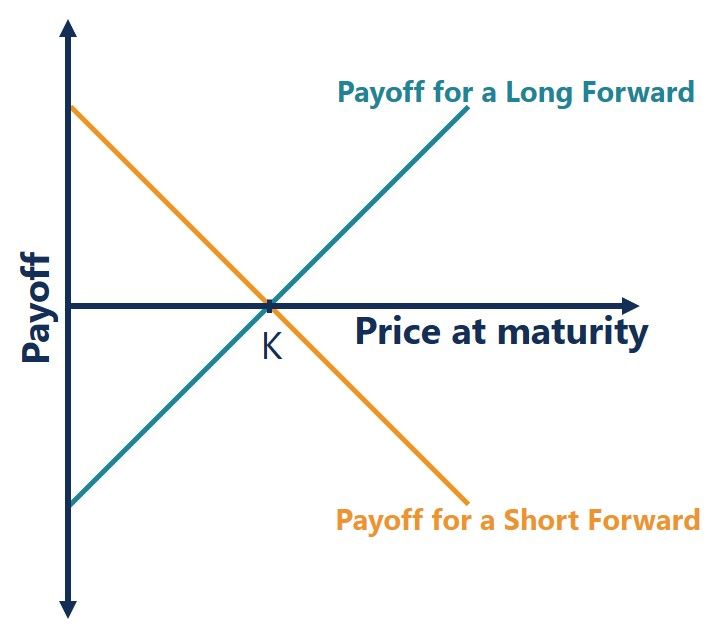
However, contracts are rarely for a single unit. To find the total profit or loss, we must multiply this per-unit payoff by the total quantity of the asset covered by the contract.
The fundamental formulas are:
- Total Profit/Loss (Long Position) =
- Total Profit/Loss (Short Position) =
Let's start with a straightforward example involving a forward contract.
2. Calculating Profit and Loss on Forward Contracts
Forward contracts are often customized in the over-the-counter (OTC) market, so the contract size is whatever the two parties agree upon. The calculation is a direct application of the formulas above.
The following reading from a lecture series at HEC Paris business school provides a clear, numerical example of this calculation for both the long and short parties in a forward contract.
[PDF] Part 3: Forward and Futures
This document formally defines the payoff formulas and then provides a concise, practical example of a forward contract for corn between a farm and Nestlé. This will solidify your understanding of the basic calculation.
First, briefly review the section Forward and futures payoffs on page 7 to see the formal equations. Then, study the worked example on pages 10-12. Focus on how the profit for the short position (the farm) and the loss for the long position (Nestlé) are calculated when the spot price at maturity is different from the agreed delivery price.
Let's break down the logic from that example:
- Parties: Nestlé (Long), Farm (Short)
- Underlying Asset: Corn
- Contract Size: 10,000 bushels
- Forward Price (K): $4.00 per bushel
- Spot Price at Maturity (): $3.40 per bushel
Calculation for the Long Position (Nestlé):
- Payoff per bushel = (a loss)
- Total Loss =
Calculation for the Short Position (the Farm):
- Payoff per bushel = (a profit)
- Total Profit =
As expected from our work with payoff diagrams, this is a zero-sum game: Nestlé's loss is the farm's gain.
3. Calculating Profit and Loss on Futures Contracts
Futures contracts add a layer of detail because they are standardized and traded on exchanges. The key parameters for calculation are the contract size (the fixed amount of the underlying asset in one contract) and the tick size (the minimum price movement).
The CME Group, one of the world's largest derivatives exchanges, has produced an excellent video explaining exactly how to calculate profit and loss using a real-world WTI crude oil futures contract.
How to Calculate Profit or Loss on Futures Contracts
This video, "How to Calculate Profit or Loss on Futures Contracts," is a practical guide that introduces the key terms and walks through a numerical example for a long futures position.
Please watch the video up to the main example. Pay close attention to these key steps: Identifying the contract size and tick size. Calculating the dollar value of a single tick move. Determining the total price move in ticks. Calculating the final profit or loss per contract.
Let's summarize the WTI crude oil example from the video to ensure the steps are clear:
-
Identify Contract Details:
- Position: Long 1 WTI futures contract
- Contract Size: 1,000 barrels
- Tick Size: $0.01 per barrel
- Entry Price (K): $53.60
- Exit Price (): $54.00
-
Calculate the Price Move:
- Price difference = per barrel.
-
Calculate the Total Profit:
- Method A (Directly using total contract value):
- Profit per barrel = $0.40
- Total Profit = Profit per barrel Contract Size =
- Method B (Using Ticks, as shown in the video):
- Value of 1 tick = Tick Size Contract Size =
- Number of ticks moved = Price difference / Tick Size = ticks
- Total Profit = Value of 1 tick Number of ticks moved =
- Method A (Directly using total contract value):
Both methods yield the same result. Losses are calculated in exactly the same way. If the price had fallen to $53.00, the loss would have been .
Example: A Short Futures Position
Now, let's apply this to a short position. We can use another example from the HEC Paris PDF, this time concerning S&P 500 ESG Index Futures.
[PDF] Part 3: Forward and Futures
This reading provides a clear calculation for a short futures position.
Please read the example on pages 30-31, starting with this section. Note how the profit is calculated for a bearish (short) bet.
Here's the breakdown:
- Position: Short 10 E-mini S&P 500 ESG futures contracts
- Contract Size: $500 \times$ the Index Value
- Entry Price (K or ): 316 index points
- Exit Price (): 300 index points
Calculation for the Short Position:
- Profit per index point = points
- Profit per contract =
- Total Profit =
This demonstrates a profitable short trade, where the trader correctly anticipated a fall in the market.
4. Application: The Role of P&L in Hedging
These profit and loss calculations are not just for speculation. Their primary purpose in corporate finance is hedging, where a company uses a derivative to offset a risk it faces in its normal business operations. The profit or loss from the futures contract is designed to cancel out a loss or profit in the physical market.
The article "Using Futures for Hedging" provides an excellent example of an oil refiner using a short futures position to lock in a selling price.
Using Futures for Hedging - AnalystPrep
This article explains how profits and losses on futures are used in a hedging context.
Read the section Short Hedge, focusing on the numerical example for Oelig, the oil refining company. Pay attention to how the profit on the futures contract in Scenario 1 offsets the lower revenue from selling the physical oil.
In Scenario 1 of that example, the oil price falls to $55.
- The company receives less for its physical oil than it hoped.
- However, its short futures position generates a profit of $27.5 million.
- The profit from the futures contract effectively compensates the company for the fall in the physical oil price, allowing it to achieve a net selling price close to the original futures price of $60.50.
This shows the practical importance of being able to accurately calculate the profit or loss on a futures position as a core component of a risk management strategy.
Conclusion
In this lesson, we have moved from the theoretical structure of payoff diagrams to the practical arithmetic of calculating profits and losses.
Key Takeaways:
- The total profit or loss on a forward or futures contract is the per-unit payoff multiplied by the contract size.
- For a long position, the profit is .
- For a short position, the profit is .
- Futures contracts require attention to standardized contract sizes and tick values to arrive at the final dollar amount.
- These calculations are fundamental to both speculation and, more importantly for corporate finance, hedging business risks.
We have now solidified our understanding of linear derivatives. In our next lesson, we will introduce a new type of derivative with a fundamentally different risk profile: options. You will see how options create asymmetric, non-linear payoffs, allowing users to cap their downside risk while retaining upside potential. This will require us to construct and interpret entirely new kinds of payoff diagrams.