Introduction
In our last lesson, we focused on calculating profit and loss for forward and futures contracts, which have linear, symmetrical payoff structures. A gain for the long position is a perfectly mirrored loss for the short position. Today, we venture into the world of options, a class of derivatives defined by their non-linear, asymmetric payoffs. This asymmetry is what makes options such powerful and versatile tools for both hedging and speculation.
This lesson is dedicated to building your visual intuition for options. Our goal is to construct and interpret the profit and loss diagrams for the four fundamental option positions: buying a call, selling a call, buying a put, and selling a put. By understanding the shape of these diagrams, you'll be able to instantly recognize the risk profile and market view associated with each position. This visual foundation is crucial before we dive into more detailed calculations in our next session.
1. From Linear to Non-Linear: Payoff vs. Profit in Options
Unlike forwards, where you have an obligation to transact, an option gives the buyer the right, but not the obligation, to do so. This choice creates a "kink" in the payoff profile. Let's distinguish two key concepts:
- Payoff (or Intrinsic Value): This is the value of the option at expiration, ignoring the initial cost (premium). It can never be negative, because the holder will simply not exercise the option if it's not profitable to do so.
- Profit/Loss: This is the net financial outcome after accounting for the premium. For the buyer, Profit = Payoff - Premium Paid. For the seller, Profit = Payoff (a loss to them) + Premium Received.
The diagram below illustrates the pure payoff (intrinsic value) for a buyer of a call or put option. Notice the characteristic "hockey stick" shape, which comes from the choice to not exercise when the option is "out-of-the-money".
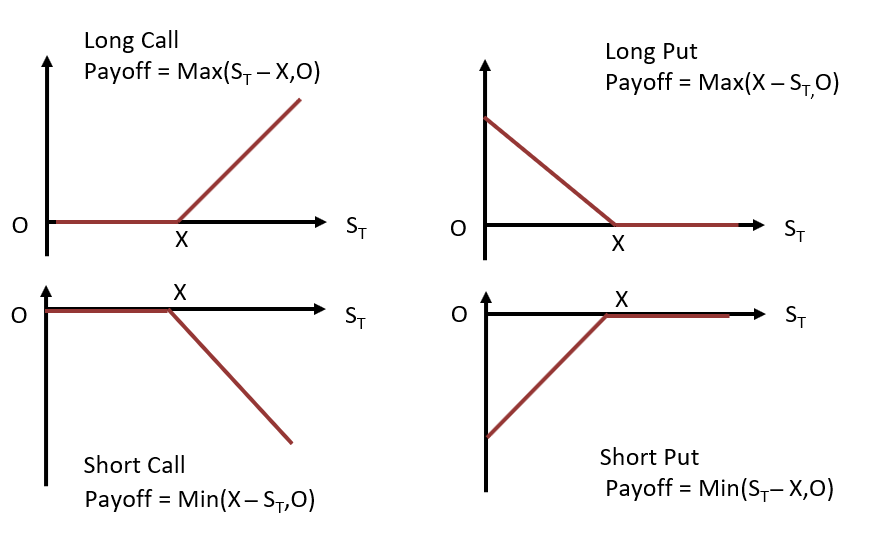
Let's look at the formulas that produce these shapes:
- Call Option Payoff:
- Put Option Payoff:
Here, is the spot price of the underlying at expiration, and is the fixed strike price. The function is the mathematical representation of the holder's choice: if the exercise value is negative, they abandon the option, and the payoff is zero.
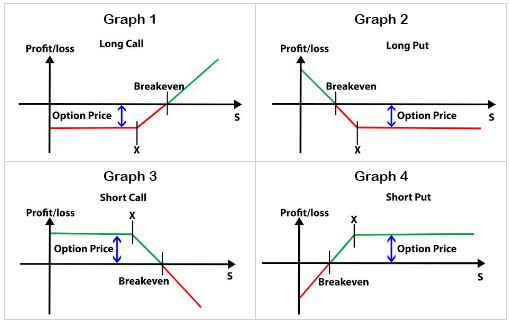
When we adjust for the premium, we get the full profit/loss diagram. This is what we will focus on constructing for the rest of the lesson.
2. The Four Building Blocks of Option Strategies
Every complex option strategy is built from four basic transactions. We will now explore the profit/loss diagram for each one. The following video provides an excellent step-by-step walkthrough with clear numerical examples. We will watch it in segments as we discuss each position.
Call and Put Options Explained: The Ultimate Guide
The video "Call and Put Options Explained: The Ultimate Guide" by Ryan O'Connell, CFA, FRM, clearly breaks down how to construct the profit and loss diagram for each of the four basic option positions.
We will work through this video section by section. For now, just get ready to watch the first part on the long call.
2.1 The Long Call: A Bet on the Upside
When you buy (go "long") a call option, you are expressing a bullish view. You believe the price of the underlying asset will rise significantly. You pay a premium for the right to buy the asset at the strike price .
Your risk is limited to the premium you paid, while your potential profit is, in theory, unlimited.
Now, let's see how this is constructed.
Call and Put Options Explained: The Ultimate Guide
Let's watch the first segment of the video, which explains the long call position.
Watch from the beginning until the end of the long call example. Pay close attention to how the initial cost (premium) shifts the payoff line down, creating a region of loss and defining a break-even point.
As the video demonstrated, the key features of the long call profit/loss diagram are:
- Maximum Loss: Limited to the premium paid. This occurs if .
- Break-even Point: The stock price at which you recover your premium. It is calculated as: Strike Price + Premium.
- Profit Zone: Occurs when . The profit potential is unlimited.
2.2 The Short Call: A Bet on Stagnation or a Fall
When you sell (or "write") a call option, you take the other side of the trade. You receive a premium in exchange for taking on the obligation to sell the asset at the strike price if the buyer chooses to exercise. This is a neutral to bearish position.
Your potential profit is limited to the premium you received, but your potential loss is unlimited. This makes selling "naked" calls a very risky strategy.
Call and Put Options Explained: The Ultimate Guide
Now, let's examine the seller's perspective in the next part of the video.
Watch the segment on the short call, from this timestamp. Notice how the profit/loss diagram is a mirror image of the long call, reflected across the horizontal axis.
The short call profit/loss diagram is characterized by:
- Maximum Profit: Limited to the premium received. This is achieved if .
- Break-even Point: The same as for the long call: Strike Price + Premium.
- Loss Zone: Occurs when . The potential loss is unlimited, accelerating as the stock price rises.
2.3 The Long Put: A Bet on the Downside
If you are bearish and believe an asset's price will fall, you can buy a put option. This gives you the right to sell the asset at the strike price .
Similar to a long call, your risk is limited to the premium paid. Your profit potential is substantial but capped, as the asset's price cannot fall below zero.
Call and Put Options Explained: The Ultimate Guide
Next, the video explains the buyer's side of a put option.
Please watch from the start of the put option section up to the end of the long put example. Observe how the profit now increases as the stock price falls.
The key features of the long put profit/loss diagram are:
- Maximum Loss: Limited to the premium paid. This occurs if .
- Break-even Point: The stock price at which you recover your premium. It is calculated as: Strike Price - Premium.
- Profit Zone: Occurs when . The maximum possible profit is , which would occur if the stock price fell to zero.
2.4 The Short Put: A Bet on Stability or a Rise
Finally, selling a put option is a neutral to bullish strategy. You receive a premium and accept the obligation to buy the asset at the strike price if the holder exercises their right.
Your profit is limited to the premium, while your potential loss is substantial (though capped, as the price can only fall to zero).
Call and Put Options Explained: The Ultimate Guide
Let's complete the picture with the final basic position: the short put.
Watch the last segment of the video from this timestamp. Again, notice the inverted relationship compared to the long put.
The short put profit/loss diagram is characterized by:
- Maximum Profit: Limited to the premium received, achieved if .
- Break-even Point: The same as for the long put: Strike Price - Premium.
- Loss Zone: Occurs when . The maximum possible loss is substantial.
3. A Consolidated View and Key Terminology
We have now constructed the diagrams for all four basic positions. The image below brings them all together for easy comparison.
To precisely interpret these diagrams, especially for exam purposes, it's helpful to use standard terminology for an option's status. This is known as its "moneyness".
Call & Put Option Payoff Charts + Formulas (CFA/FRM)
This article from AnalystPrep provides formal definitions crucial for your exam preparation.
Please read the section titled Moneyness. Focus on the specific conditions for call and put options to be considered in-the-money (ITM), at-the-money (ATM), and out-of-the-money (OTM).
In short:
- In-the-Money (ITM): The option has a positive intrinsic value. A call is ITM if ; a put is ITM if .
- Out-of-the-Money (OTM): The option has zero intrinsic value. A call is OTM if ; a put is OTM if .
- At-the-Money (ATM): The stock price equals the strike price, .
Notice that an option being in-the-money does not guarantee a profit. For a buyer, the option must be sufficiently deep in-the-money to overcome the initial premium paid.
Conclusion
In this lesson, we have constructed and interpreted the profit/loss diagrams for the four fundamental option positions. These visual tools are indispensable for understanding the risk and reward of any option strategy.
Key Takeaways:
- Unlike the linear payoffs of forwards, options have asymmetric, non-linear payoffs due to the holder's right, but not obligation, to exercise.
- Option buyers (long positions) have limited risk (the premium paid) and significant profit potential.
- Option sellers (short positions) have limited profit (the premium received) and significant, often unlimited, risk.
- The break-even point for a call is , while for a put it is .
- An option's moneyness (ITM, ATM, OTM) describes its intrinsic value relative to the strike price at any given moment.
In our next lesson, we will put this visual framework into practice. We will focus on applying the profit and loss formulas to perform detailed calculations for various scenarios, solidifying your ability to quantify the financial outcomes of these positions.