Introduction
In our previous lesson, we built a strong visual foundation by constructing and interpreting the profit and loss diagrams for the four fundamental option positions. We saw how the "right, not the obligation" for the buyer creates a distinctive, asymmetric "hockey stick" payoff shape. You learned to identify the market view, risk profile, and break-even points associated with buying and selling calls and puts just by looking at their P/L graphs.
Today, we will move from this visual intuition to precise calculation. Our goal is to apply the formulas that underpin those diagrams to calculate the exact profit or loss on long and short positions in call and put options for any given scenario. This lesson is heavily focused on numerical application, which will be excellent practice for the quantitative questions you'll face in the CB1 exam.
1. Payoff vs. Profit: A Crucial Distinction
Before we start calculating, it's vital to be absolutely clear on the difference between an option's payoff and its profit. Confusing the two is a common mistake.
- Payoff (also called intrinsic value at expiration) is the gross value you realize from exercising the option, ignoring the initial cost. It is calculated purely based on the strike price and the final stock price. Because you would never exercise an option to lose money, the payoff can never be negative.
- Profit (or Loss) is your final, net financial outcome. It accounts for the premium you either paid (for a long position) or received (for a short position).
Let's watch a short video segment that explains this difference clearly.
Options Payoffs and Profits & Losses (Calculations for CFA® and FRM® Exams)
The video "Options Payoffs and Profits & Losses" from AnalystPrep begins by highlighting the common confusion between payoff and profit.
Watch from the start of this section. The speaker uses a helpful analogy, thinking of payoff as "revenue" and profit as "revenue minus cost".
With this distinction in mind, we can now define the profit calculation for each of our four basic positions.
2. The Four Profit Formulas
In the last lesson, we saw the payoff formulas. To get to the profit, we simply adjust for the premium. Let be the stock price at expiration, be the strike price, be the call premium, and be the put premium.
- Long Call Profit = Payoff - Premium =
- Short Call Profit = Premium - Payoff =
- Long Put Profit = Payoff - Premium =
- Short Put Profit = Premium - Payoff =
The following video segment summarizes these formulas perfectly.
Options Payoffs and Profits & Losses (Calculations for CFA® and FRM® Exams)
This next clip from the AnalystPrep video lays out the profit and loss formulas for all four positions.
Watch the section from this timestamp. Notice how each formula is just the payoff we learned about before, adjusted by adding or subtracting the relevant premium.
Now, let's apply these formulas with some concrete numbers.
3. Calculating Profit and Loss: Worked Examples
The best way to master these calculations is to work through examples. We will look at call and put options in turn, considering both the buyer (long position) and the seller (writer/short position).
3.1 Call Options
Let's assume a call option has a strike price (K) of $100 and a premium (c) of $10.
Long Call Example
You buy this call option. You are hoping the stock price rises significantly above $100.
Let's analyze the profit at three different expiration prices: , , and .
- If : The option is out-of-the-money. You would not exercise it (why buy for $100 what you can get for $90 in the market?). The payoff is .
- Your profit = Payoff - Premium = . You lose the entire premium.
- If : The option is at-the-money. The payoff is .
- Your profit = Payoff - Premium = . You still lose the premium.
- If : The option is in-the-money. You exercise it, buying the stock for $100 and its market value is $115. The payoff is .
- Your profit = Payoff - Premium = . You make a $5 profit.
The break-even point is where the profit is zero. For a long call, this occurs when , or . In this case, . At a stock price of $110, your payoff is $10, which exactly covers your $10 premium.
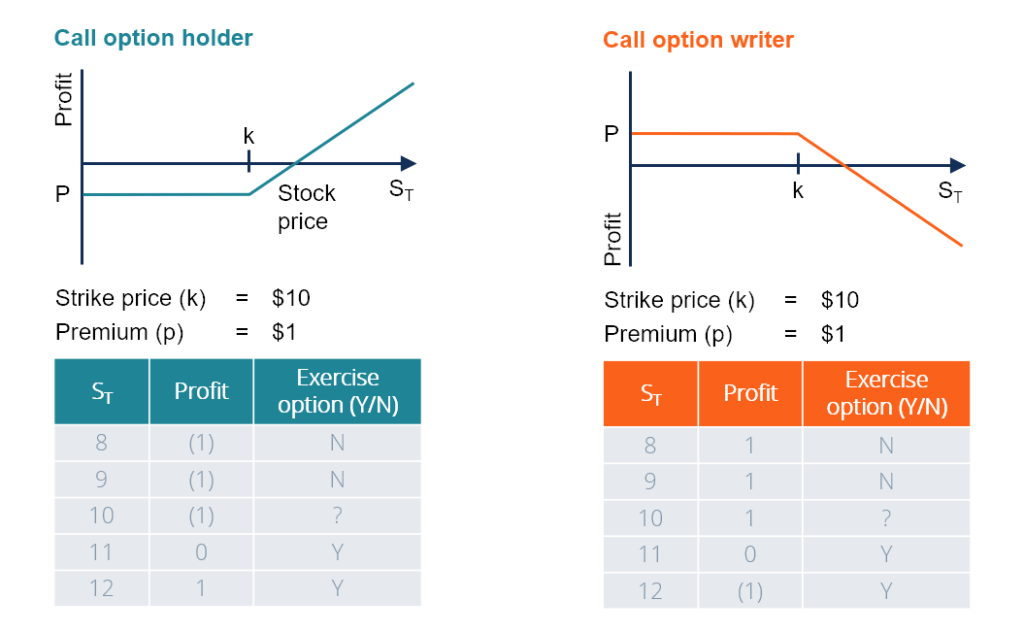
The image below illustrates these calculations for a slightly different example. The graph plots the profit, while the table shows the specific profit calculations at various stock prices for both the buyer (holder) and seller (writer).
Short Call Example
Now, imagine you are the writer of the same call option. Your outcomes are the exact opposite of the buyer's.
- If : The buyer does not exercise. You keep the premium.
- Your profit = Premium - Payoff = .
- If : The buyer exercises. You are forced to sell a stock worth $115 for only $100, for a loss of $15 on the transaction itself.
- Your profit = Premium - Payoff = . You lose $5.
The break-even point is the same, $110. Your potential profit is capped at the $10 premium, while your potential loss is unlimited.
3.2 Put Options
Now let's consider a put option with a strike price (K) of $100 and a premium (p) of $8.
Long Put Example
You buy this put option, betting that the stock price will fall below $100.
Let's analyze the profit at three different expiration prices: , , and .
- If : The option is in-the-money. You exercise it, selling a stock worth $85 for the strike price of $100. The payoff is .
- Your profit = Payoff - Premium = .
- If : The option is at-the-money. Payoff is .
- Your profit = Payoff - Premium = .
- If : The option is out-of-the-money. You don't exercise. Payoff is .
- Your profit = Payoff - Premium = .
The break-even point for a long put is where , or . Here, . If the price falls to $92, your payoff is $8, which perfectly offsets the $8 premium.
Short Put Example
As the writer of this put, your outcomes are again the mirror image.
- If : The buyer exercises. You must buy a stock worth $85 for $100, incurring a $15 loss on the transaction.
- Your profit = Premium - Payoff = .
- If : The buyer does not exercise. You keep the premium.
- Your profit = Premium - Payoff = .
The break-even point is the same, $92. Your profit is capped at the $8 premium, and your maximum loss is substantial (if the stock price falls to zero, your loss would be ).
To see these calculations performed step-by-step, the following video provides a very clear walkthrough.
Constructing Call and Put Option Payoff Diagrams in Excel
The video "Constructing Call and Put Option Payoff Diagrams in Excel" by Ryan O'Connell, CFA, FRM, methodically builds the profit calculations for all four positions.
We'll walk through this video to solidify the calculations: Long Call: Watch how the profit is calculated for a range of stock prices. Short Call: Note how it's the exact opposite of the long call. Long Put: See the profit calculation for a bearish position. Short Put: Finally, observe the mirror image of the long put.
4. An Integrated Exam-Style Problem
Now let's tackle a problem that combines these concepts, similar to what you might see on the exam.
Problem: Assume that a put and a call on XYZ stock both have a strike price of $35. The call premium is $2, and the put premium is $3. What is the profit on a long call position AND a long put position if the price of the stock at expiration is $28?
Take a moment to apply the formulas yourself before watching the solution.
- Long Call Profit:
- Long Put Profit:
Ready? Let's watch the explanation.
Options Payoffs and Profits & Losses (Calculations for CFA® and FRM® Exams)
This final clip from the AnalystPrep video walks through the exact problem posed above.
Watch the solution from this timestamp. Compare the video's step-by-step calculation with your own.
As the video explains:
- Long Call: With and , the call is out-of-the-money. The payoff is 0. The profit is . A $2 loss.
- Long Put: With and , the put is in-the-money. The payoff is . The profit is . A $4 gain.
Conclusion
In this lesson, we translated the visual P/L diagrams from our last session into concrete, calculable figures. By mastering a few simple formulas, you can now determine the precise financial outcome for any of the four basic option positions, given a strike price, a premium, and an expiration price.
Key Takeaways:
- Profit is distinct from payoff; profit always accounts for the initial option premium.
- The profit for any option position can be calculated using one of four core formulas:
- Long Call Profit =
- Short Call Profit =
- Long Put Profit =
- Short Put Profit =
- The break-even point is where the option's payoff exactly equals the premium paid. For a call, this is ; for a put, it is .
In our next lesson, we will explore put-call parity. This is a fundamental relationship in options pricing that connects the prices of European calls and puts. It builds directly on our understanding of option payoffs and will show you how, in an efficient market, the price of a call implies the price of a corresponding put, and vice versa.