Introduction
In our previous lesson, we explored how to hedge against systematic risk in an equity portfolio using futures. A key component of that calculation was beta (), the measure of a portfolio's sensitivity to overall market movements. We are now going to see beta in a new, but related, context. Instead of just being a risk to be managed, it is also a fundamental input for determining the return that investors should demand from an investment.
This lesson introduces the Capital Asset Pricing Model (CAPM), a cornerstone of modern finance. Its purpose is to estimate the expected return on an equity investment, also known as the cost of equity (). The model provides a clear, quantitative link between the systematic risk of a stock and the return shareholders require for bearing that risk. Your goal for this lesson is to be able to estimate the cost of equity using the Capital Asset Pricing Model (CAPM). This calculation is the first major step toward finding a company's overall cost of capital, a topic we will build on throughout this module.
1. The Capital Asset Pricing Model (CAPM)
At its heart, the CAPM formalizes a simple, powerful idea: the return investors expect from a stock should be composed of two parts:
- A baseline return for investing in a risk-free asset.
- An additional return (a premium) to compensate them for taking on the stock's specific level of market-related risk.
The model provides a precise formula to calculate this. To begin, watch the following video which introduces the CAPM, its formula, and a basic calculation.
What is Capital Asset Pricing Mode (CAPM) | with Calculation Examples
This video from Counttuts provides an excellent introduction to the Capital Asset Pricing Model and its application.
Please watch the following segments: First, watch the introduction from the beginning to understand what CAPM is and its specific purpose in calculating the cost of equity. Next, focus on the section that presents the CAPM formula and defines each variable. Finally, follow the first worked example, which shows a straightforward application of the formula. Note how the presenter substitutes each value to arrive at the cost of equity.
As you saw in the video, the CAPM formula is:
Where:
- = Cost of Equity (the required rate of return)
- = Risk-Free Rate
- = Beta of the stock
- = Expected Return of the Market
- = Equity Risk Premium (ERP)
2. Deconstructing the CAPM Components
To use the model effectively, you need a solid understanding of its inputs. Given your background in statistics, you can think of the CAPM as a simple linear model where the cost of equity is a function of a single risk factor, beta.
Let's examine each component in more detail.
Capital Asset Pricing Model (CAPM) | Formula + Calculator
This article from Wall Street Prep provides a clear breakdown of the CAPM formula and its components.
Please read the following two sections: Start by reviewing the CAPM Formula section for a concise summary. Then, read the section "What is the Full-Form CAPM Equation?", which explains each of the three components—Risk-Free Rate, Beta, and Equity Risk Premium—in detail. Pay particular attention to the discussion of beta and how it measures systematic risk.
Here's a summary of the key inputs and what they represent:
-
Risk-Free Rate (): This is the theoretical rate of return of an investment with zero risk. In practice, it's proxied by the yield on a long-term government bond (e.g., the 10-year UK Gilt or U.S. Treasury bond) in the same currency as the investment. It represents the baseline compensation investors receive for the time value of money alone.
-
Beta (): As we saw in the previous lesson, beta measures the volatility, or systematic risk, of a security in comparison to the market as a whole.
- : The stock's price tends to move in line with the market.
- : The stock is more volatile than the market (e.g., a high-growth tech stock). It will amplify market movements, both up and down.
- : The stock is less volatile than the market (e.g., a stable utility company).
- From a statistical perspective, beta is the slope coefficient obtained from a linear regression of the individual stock's returns (the dependent variable) against the market's returns (the independent variable).
-
Equity Risk Premium (ERP): This is the term . It represents the excess return that investing in the stock market as a whole provides over the risk-free rate. It is the compensation investors demand for taking on the average level of risk in the equity market. The ERP is then scaled by the specific stock's beta to find the appropriate risk premium for that individual stock.
3. CAPM in Action: Calculation and Interpretation
The best way to understand the model is to apply it. The calculation is a straightforward implementation of the formula. Below is an example of how this looks in a spreadsheet, calculating the cost of equity for three different companies.
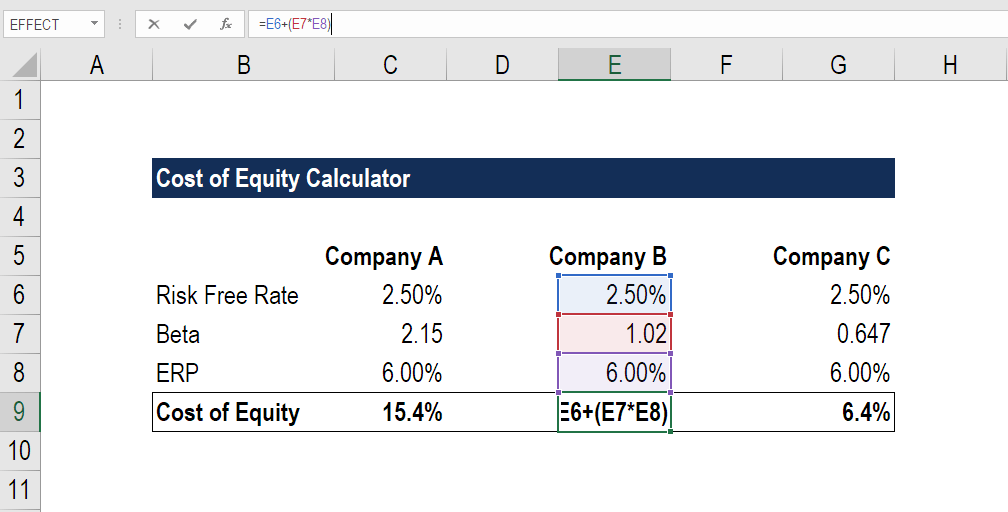
Notice how Company A, with the highest beta (2.15), has the highest cost of equity (15.4%), while Company C, with the lowest beta (0.647), has the lowest cost of equity (6.4%). This illustrates the core principle of the model: higher systematic risk demands a higher required return.
The next video provides another worked example and explicitly demonstrates how the cost of equity changes when beta is adjusted. This will solidify your understanding of the direct relationship between risk and return.
[9/12] Cost of Equity | CAPM | Cost of Capital Financial Management | Solved Problem | Kauserwise
This video from Kauser Wise walks through a complete CAPM problem, including recalculating the cost of equity with different beta values.
Please watch the entire video from the start of the problem. First, observe how the initial cost of equity is calculated using the given inputs. Then, pay close attention as the speaker recalculates the cost of equity twice: once with a higher beta and once with a lower beta. Notice the direct impact these changes have on the final result.
4. The Security Market Line (SML)
The relationship defined by the CAPM can be visualized as a straight line known as the Security Market Line (SML). This graph plots the expected return of an investment on the y-axis against its systematic risk (beta) on the x-axis.
Capital Asset Pricing Model (CAPM) | Formula + Calculator
The Security Market Line (SML) graphically represents the CAPM. The line's intercept is the risk-free rate (R_f), and its slope is the equity risk premium (R_m - R_f). Any correctly priced asset, according to CAPM, will lie on this line.
Let's interpret this graph:
- The y-intercept is the risk-free rate (). This is the return you would expect if beta were zero (i.e., no systematic risk).
- The slope of the line is the Equity Risk Premium (). It shows how much additional return the market demands for each additional unit of systematic risk.
- Any stock or portfolio, if priced correctly according to the model, should lie on the SML. For a given level of risk (), the SML tells you the fair, expected return ().
The SML provides a powerful benchmark. In theory, if a stock lies above the SML, it is considered undervalued because it offers a higher return than what is required for its level of risk. If it lies below the SML, it is overvalued.
Conclusion
In this lesson, we have demystified the Capital Asset Pricing Model, a crucial tool for any financial analyst. You have learned how to use the CAPM to translate a stock's systematic risk into a required rate of return for its investors.
Key Takeaways:
- The Cost of Equity () is the return shareholders require for investing in a company.
- The Capital Asset Pricing Model (CAPM) is a model used to estimate this cost: .
- The model states that the required return is the risk-free rate plus a premium for risk.
- This risk premium is determined by the stock's beta (), which measures its sensitivity to market-wide movements.
- A higher beta implies higher systematic risk, leading directly to a higher cost of equity.
- The Security Market Line (SML) is the graphical representation of the CAPM, illustrating the linear relationship between risk and expected return.
While CAPM is the most widely used model for estimating the cost of equity, it is not the only one. In our next lesson, we will explore an alternative approach: the Dividend Growth Model. This will provide another perspective on valuation and allow you to compare and contrast two different methods for arriving at the same important figure.