Introduction
In our last lesson, we delved into the Capital Asset Pricing Model (CAPM) to estimate a company's cost of equity by quantifying its systematic risk through beta. Today, we will explore an alternative, yet equally important, method: the Dividend Growth Model (DGM). This approach shifts the focus from market risk to the company's own dividend policy and expected growth.
The core idea of the DGM is that an investor's required return on a share is composed of two elements: the income from dividends (dividend yield) and the capital gain from the share's price appreciation, which is assumed to be driven by the growth in future dividends. Your objective for this lesson is to learn how to estimate the cost of equity using the Dividend Growth Model, a crucial skill for your CB1 exam preparation and a valuable tool for valuation.
1. From Valuation to Cost of Equity: The DGM Formula
The Dividend Growth Model is a direct rearrangement of the Gordon Growth Model (GGM), a well-known formula used to find the intrinsic value of a stock. The GGM states that the current price of a stock () is the present value of all its future dividends, assuming they grow at a constant rate () forever.
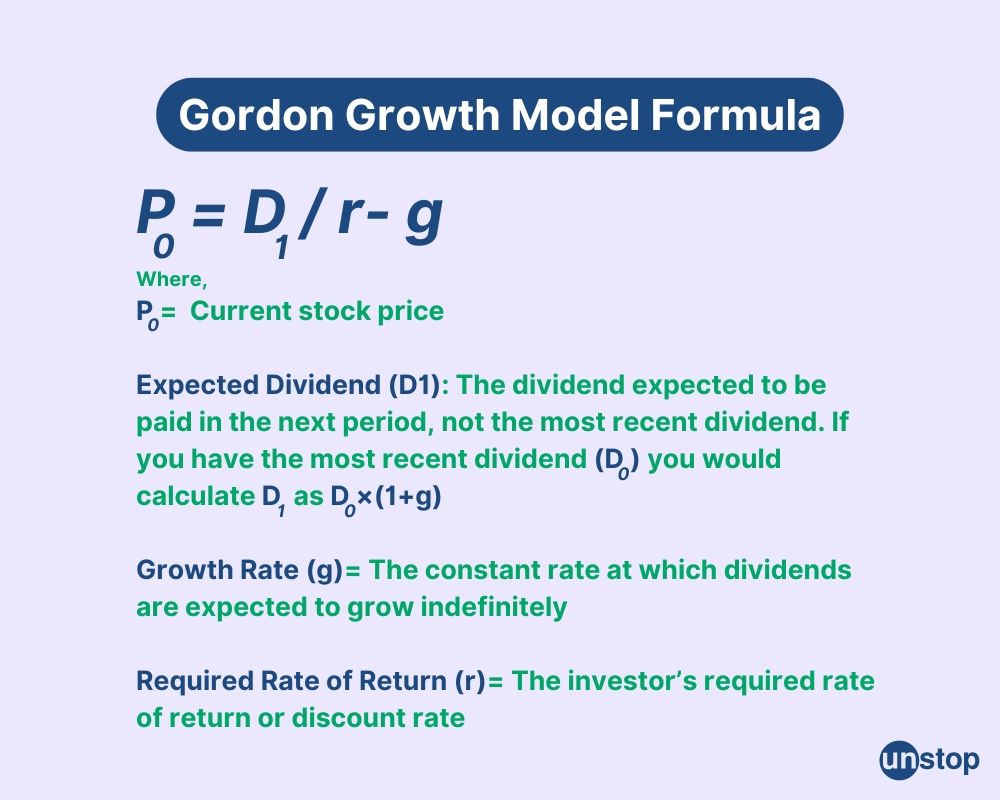
The formula for the Gordon Growth Model is:
Where:
- is the current market price per share.
- is the dividend expected to be paid in one year's time.
- is the cost of equity (the required rate of return for shareholders).
- is the constant annual growth rate of dividends.
To find the cost of equity (), we simply need to rearrange this formula. With some basic algebra, we can isolate :
This is the Dividend Growth Model formula for the cost of equity. It tells us that the cost of equity is the sum of the expected dividend yield () and the capital gains yield (which is assumed to be equal to the dividend growth rate, ).
For a clear explanation of this formula and its components, please consult the following reading.
What Is Cost of Equity? Formula, Calculation & Examples
This article from Valuation Master Class clearly presents the Dividend Growth Model formula and defines its components.
Please read the section titled The DGM Formula, and then jump to the FAQ at the end to read the answer to the question "What is the dividend growth model cost of equity formula?". This will solidify your understanding of the formula's derivation and its key variables.
2. Applying the DGM: Calculation Examples
With the formula established, let's put it into practice. The calculation is typically a two-step process if you are given the most recently paid dividend () instead of the expected next dividend ().
- Calculate the next dividend ():
- Apply the DGM formula:
Let's walk through an example:
A company's stock currently trades at £4.20 (). It has just paid an annual dividend of 40p (), and dividends are expected to grow at 6% per year (). What is the cost of equity?
- Find :
- Find :
or 16.1%
The following video from OpenTuition, a provider specializing in accountancy and finance exam preparation, offers excellent worked examples that mirror the style you might encounter in your CB1 exam.
The cost of capital – The cost of equity - ACCA Financial Management (FM)
This video provides clear, exam-focused examples of calculating the cost of equity using the DGM.
Watch the segment from the introduction of the formula through the two examples. The presenter walks through the formula and then applies it to "Example 2" and "Example 3". Follow his calculations closely and try them on your calculator to ensure you get the same results. Note his emphasis on learning the rearranged formula for the exam.
3. The Most Important Variable: Estimating the Growth Rate (g)
The DGM is simple to calculate, but its accuracy depends entirely on the dividend growth rate, . This is an estimated future rate, making it the most subjective and critical input. As a statistician, you can think of this as a forecasting challenge. There are two primary methods for estimating 'g'.
Method 1: Using Historical Growth
This method assumes that past dividend growth is a reasonable predictor of future growth.
-
Geometric Average Growth: This is a standard financial method that captures the compound growth rate over a period. It is calculated by taking the n-th root of the ratio of the last dividend to the first dividend.
where is the number of growth periods (e.g., if you have 5 years of data, there are 4 growth periods).
-
Arithmetic Average Growth: This involves calculating the growth rate for each year individually and then taking a simple average of those rates.
The following videos demonstrate both of these approaches.
The cost of capital – The cost of equity - ACCA Financial Management (FM)
The OpenTuition video demonstrates the geometric average method.
Please watch the section explaining how to estimate the growth rate from past dividends. Pay close attention to how the presenter sets up the equation and solves for 'g' using the fourth root. This is a common exam-style question.
(4 of 17) Ch.14 - Cost of equity: example using "dividend growth model" approach
This video from Teach me finance demonstrates the arithmetic average method.
Now, watch this segment to see an alternative approach of calculating individual annual growth rates and averaging them. Notice how the 'new minus old over old' formula is used for each year before the average is taken.
Method 2: The Retention Growth Model
This model, also known as Gordon's Growth Model, provides a more forward-looking estimate of 'g' based on the company's own financial policies. It assumes that growth is generated by reinvesting a portion of the company's earnings.
The formula is:
Where:
- = Retention Rate: The proportion of earnings that are not paid out as dividends. It's calculated as (1 - Dividend Payout Ratio).
- = Return on Investment: The rate of return the company earns on the equity it reinvests. This is often proxied by the Return on Equity (ROE).
This video provides an excellent illustration of this concept and a comprehensive example.
The cost of capital – The cost of equity - ACCA Financial Management (FM)
This segment explains the 'g = b x r' model and applies it in a full example.
First, watch the conceptual explanation from "RB growth" to understand how retaining earnings drives dividend growth. Then, watch the complete worked example from "Example 6", where 'g' is first calculated using the retention model and then used to find the cost of equity with the DGM formula. This is a classic multi-step problem.
4. Comparing DGM and CAPM
Now that you know two methods for calculating the cost of equity, it's essential to understand their differences, strengths, and weaknesses. Neither model is perfect; they are tools that provide estimates based on different assumptions.

The following table and video summarize the key differences.
What Is Cost of Equity? Formula, Calculation & Examples
This table provides a concise side-by-side comparison of the two models.
Please read the section "CAPM vs. Dividend Growth Model" and study the comparison table. Pay attention to the limitations of each model.
The key takeaways from the comparison are:
- Applicability: CAPM can be used for any public company (with a calculable beta), while DGM only works for mature, stable companies that pay dividends and are expected to grow at a constant rate.
- Risk: CAPM explicitly incorporates systematic risk through beta. DGM accounts for risk implicitly through the market price () and the growth rate (). A riskier company will generally have a lower stock price (increasing the dividend yield) and possibly different growth expectations, thus leading to a higher cost of equity.
- Sensitivity: The DGM result is highly sensitive to the estimate for 'g'. A small change in 'g' can have a significant impact on the calculated cost of equity.
Conclusion
In this lesson, you've learned to use the Dividend Growth Model as a powerful alternative to CAPM for estimating the cost of equity. We've seen how it is derived from a valuation model and how its application hinges on a credible estimate of future dividend growth.
Key Takeaways:
- The Dividend Growth Model (DGM) formula is , where is the cost of equity, is the next dividend, is the current price, and is the constant dividend growth rate.
- The model conceptualizes the required return as the sum of the dividend yield and the capital gains yield ().
- The growth rate () can be estimated using historical dividend data (geometric or arithmetic average) or through the retention model ().
- The DGM is best suited for stable, dividend-paying companies and is highly sensitive to the growth rate assumption, whereas CAPM is more versatile and explicitly models systematic risk.
We have now covered the two primary methods for calculating the cost of equity. In the next lesson, we will turn our attention to the other major source of long-term capital: debt. You will learn how to calculate the cost of debt, which is the next essential piece of the puzzle needed to determine a company's overall cost of capital.