Hello! Welcome back to our course.
In our last lesson, we established a flexible and secure configuration system using YAML files, allowing us to manage application settings and API keys outside of our source code. This was a crucial step in making our trading framework maintainable.
Now, we address another cornerstone of any serious application: visibility. A trading system that runs silently is a black box, making it impossible to debug issues, verify behavior, or understand its decision-making process. Simple print() statements are inadequate as they lack structure, severity levels, and the ability to be easily toggled or redirected.
This lesson tackles that challenge head-on. Our learning outcome is to configure a centralized logging system to track data flow, signals, orders, and errors. We will use Python's built-in logging module to create a professional-grade setup that is configurable, performant, and writes structured, machine-readable logs. This will give us the detailed audit trail necessary for building a "foolproof" system.
The Anatomy of Python Logging
Before diving into configuration, it's essential to understand the four core components of the logging module.
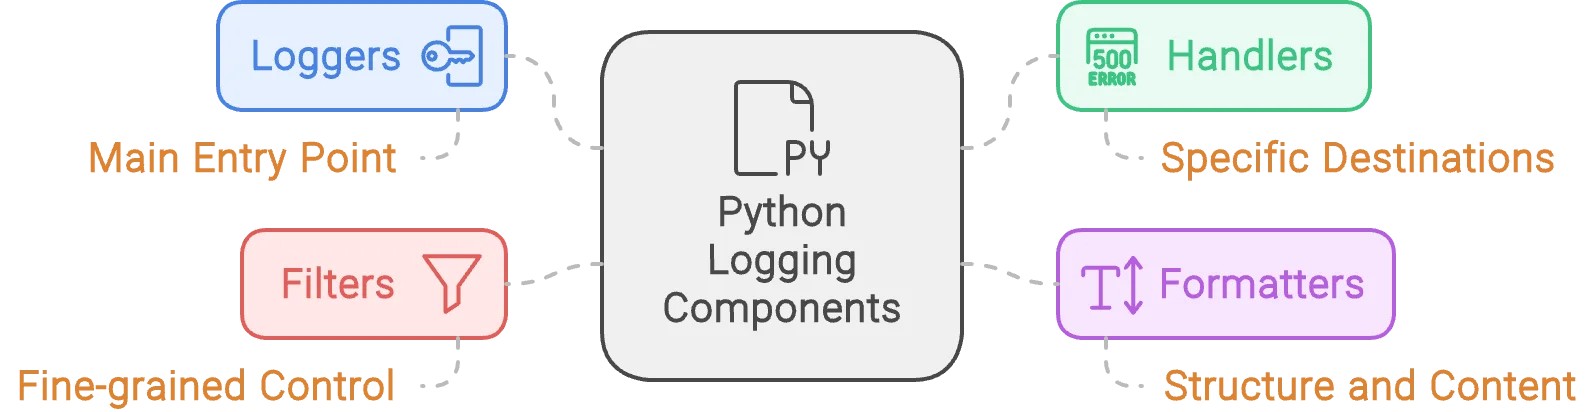
A log message, created as a LogRecord object, flows through this system:
- Logger: Your code interacts with a
Loggerinstance (logging.getLogger(__name__)) to create a log event. The logger checks the message's severity level (e.g.,DEBUG,INFO,WARNING). If the level is too low, the process stops here. - Handler: If the message passes the logger's level check, it is passed to all
Handlers associated with that logger. Each handler can also have its own level, filtering messages further. The handler's job is to dispatch the log to a specific destination (e.g., the console, a file, a network socket). - Formatter: Before the handler writes the message, it uses a
Formatterto convert theLogRecordobject into a string. This is where you define the log's structure—timestamps, level names, source file, and the message itself.
Given your IT background, you can think of this as a processing pipeline or a chain of responsibility, where each component has a distinct role in transforming and routing the event data.
The Modern Approach: dictConfig
While you can configure logging programmatically or with basicConfig, these approaches become cumbersome in a complex application. A much cleaner and more flexible method is to define the entire logging configuration in a dictionary and load it using logging.config.dictConfig. This aligns perfectly with our work in the last lesson, as we can simply store this configuration in a YAML file.
The following video provides an excellent overview of this modern approach, explaining why it's superior and demonstrating the core concepts.
The video 'Modern Python logging' by mCoding is a superb guide to professional logging setups. It explains the data flow and advocates for using dictConfig for its clarity and power.
Please watch from the beginning to 07:41. This will cover the motivation for dictConfig, the mental model of how logging components interact, and best practices for structuring your configuration.
Designing Our logging.yaml
Based on the principles from the video, let's design a logging.yaml file for our framework. Our goals are:
- See high-level status messages (
INFOand above) on the console for real-time monitoring. - Save detailed diagnostic messages (
DEBUGand above) to a rotating file for later analysis.
This requires two handlers (console and file) and two formatters (simple and detailed).
Here is our initial logging.yaml:
# logging.yaml
version: 1
disable_existing_loggers: false

formatters:
  simple:
    format: "%(asctime)s - %(levelname)s - %(message)s"
    datefmt: "%Y-%m-%d %H:%M:%S"
  detailed:
    format: "%(asctime)s - %(name)s - %(module)s:%(lineno)d - %(levelname)s - %(message)s"
    datefmt: "%Y-%m-%d %H:%M:%S"

handlers:
  console:
    class: logging.StreamHandler
    level: INFO
    formatter: simple
    stream: ext://sys.stdout
  file:
    class: logging.handlers.RotatingFileHandler
    level: DEBUG
    formatter: detailed
    filename: app.log
    maxBytes: 10485760 # 10 MB
    backupCount: 5
    encoding: utf8

loggers:
  # Configure loggers for third-party libraries if needed, e.g., to reduce verbosity
  # some_library:
  #   level: WARNING

root:
  level: DEBUG # Set the root logger to the lowest level to capture all messages
  handlers: [console, file]
Implementing the Logging Setup
Now, we need a function to load this configuration at application startup. We can create a setup_logging.py module for this.
# setup_logging.py
import yaml
import logging.config
import os

def setup_logging(default_path='logging.yaml', default_level=logging.INFO):
    """
    Setup logging configuration
    """
    path = default_path
    if os.path.exists(path):
        with open(path, 'rt') as f:
            try:
                config = yaml.safe_load(f.read())
                logging.config.dictConfig(config)
                print("✓ Logging configured successfully from file.")
            except Exception as e:
                print(f"✗ Error loading logging config: {e}. Using basic config.")
                logging.basicConfig(level=default_level)
    else:
        print("✗ logging.yaml not found. Using basic config.")
        logging.basicConfig(level=default_level)

# --- Example Usage ---
# In your main application file:
# from setup_logging import setup_logging
#
# def main():
#     setup_logging()
#     logger = logging.getLogger(__name__)
#     logger.info("Trading framework starting up...")
#     logger.debug("This is a detailed debug message.")
#     logger.error("This is an error message.")
#
# if __name__ == '__main__':
#     main()
Now, any module in your application can get its own logger with logger = logging.getLogger(__name__), and all messages will be processed by the centralized configuration we defined.
Advanced Topic 1: Structured Logging with JSON
For a data-driven application like a trading system, plain text logs are a missed opportunity. If we log in a structured format like JSON, we can easily ingest, search, and analyze our logs with automated tools. This is essential for post-trade analysis and debugging complex, intermittent issues.
There is no built-in JSON formatter, but we can easily write our own. The "Modern Python logging" video provides a perfect template for this.
Let's return to the mCoding video to see how to implement a custom JSON formatter. This is a powerful technique for creating machine-readable logs.
Watch the segment from 12:17 to 16:10. Pay close attention to how a custom JSONFormatter class is created and how the logging.yaml is modified to use it. The video also explains how to include extra contextual data, which we'll use next.
By implementing the JSONFormatter shown in the video and assigning it to our file handler, our app.log file will become a app.jsonl (JSON Lines) file, where each line is a self-contained JSON object—perfect for programmatic analysis.
Advanced Topic 2: Asynchronous Logging for Performance
In a real-time trading system, every millisecond can count. Standard logging is synchronous and blocking, meaning your main application thread has to wait for the I/O operation (like writing to a file) to complete. This can introduce unacceptable latency.
The solution is asynchronous logging. The logging module provides QueueHandler and QueueListener to solve this. Your application code quickly puts a log record onto an in-memory queue (a non-blocking operation), and a separate background thread handles the slow I/O of writing the logs to their destinations.
Once again, the mCoding video explains this beautifully.
The final advanced topic is ensuring our logging doesn't slow down our trading logic. This part of the video explains how to use a QueueHandler to make logging non-blocking.
Watch the segment from 17:07 to 19:24. This explains the performance problem and shows how to configure the QueueHandler in the YAML config and start the listener in your Python code.
To implement this, you would modify your root logger in logging.yaml to use a single queue handler, which in turn points to your console and file handlers. Then, in your setup_logging function, you would add the code to start the QueueListener.
Contextual Logging: The Final Piece
To make logs truly useful, they need context. A log message like "Order failed" is not very helpful. But "Order failed: {symbol: 'SPY', order_id: '12345', reason: 'Insufficient funds'}" is invaluable.
You can add this context by passing an extra dictionary to your logging calls.
logger = logging.getLogger(__name__)
context_data = {'symbol': 'SPY', 'order_id': '12345'}
logger.error("Failed to place order.", extra=context_data)
If you've implemented the custom JSONFormatter from the video, it can be easily modified to automatically include any keys from the extra dictionary into the final JSON output. This gives you rich, structured, and contextual logs.
Test your understanding!
Imagine you have set up the JSONFormatter and you are logging information about a data tick you just received for the SPY symbol.
logger = logging.getLogger('data_handler')
tick_details = {
    'symbol': 'SPY',
    'bid': 450.10,
    'ask': 450.12,
    'timestamp': 1678886400
}

# How would you write a DEBUG log message "Tick received" that includes
# all the details from the tick_details dictionary in the log output?
Show answer
You would use the extra parameter to pass the dictionary. The JSONFormatter would then incorporate these key-value pairs into the final log entry.
logger.debug("Tick received", extra=tick_details)
The resulting JSON log entry would look something like this:
{
  "timestamp": "2023-03-15 12:00:00,000",
  "level": "DEBUG",
  "message": "Tick received",
  "symbol": "SPY",
  "bid": 450.10,
  "ask": 450.12,
  "timestamp": 1678886400
}
Conclusion
In this lesson, we have engineered a professional logging system that is central to building a "foolproof" trading framework. We moved far beyond simple print statements to a system that is configurable, performant, and produces data ready for analysis.
Key Takeaways:
- Configuration over Code: Using
dictConfigwith a YAML file provides a clean separation of logging configuration from application logic. - Multiple Destinations: We can easily configure multiple handlers (e.g.,
StreamHandlerfor console,RotatingFileHandlerfor files) with different verbosity levels (INFOvs.DEBUG). - Structured Logging is Key: By creating a custom
JSONFormatter, we transform our logs from simple text into a valuable, machine-readable dataset. - Performance Matters: Asynchronous logging with
QueueHandlerprevents I/O from blocking our main application thread, which is critical for a real-time system. - Context is Everything: Using the
extraparameter enriches our logs with vital data like symbols and order IDs, making debugging and analysis significantly more effective.
Preview of the Next Lesson:
Our new logging system is excellent at reporting errors, providing detailed tracebacks and context. But how should our application behave when an error occurs? Simply logging an API connection failure and crashing is not a robust solution. In the next lesson, we will design and implement a custom exception hierarchy. This will allow us to catch specific error conditions (like API errors, data errors, or order errors) and handle them gracefully, moving us another step closer to a truly "foolproof" system.