Hello again! I'm glad you're back. Last time, we took a deep dive into the inner workings of a refrigerator, uncovering the four key components and the journey of the refrigerant that moves heat from inside your fridge to your kitchen. We even saw a preliminary "map" of this journey on a Temperature-Entropy (T-s) diagram.
Today, we're going to become expert map-readers. Our goal is to represent the refrigeration cycle on both T-s and P-h diagrams. While the T-s diagram is a great start, we're going to focus on the Pressure-Enthalpy (P-h) diagram, which is the go-to tool for engineers working with refrigeration and air conditioning. Mastering these diagrams will turn the abstract processes into something you can see, trace, and analyze. It's how we transform the physical components into a thermodynamic picture.
Let's get started on our walk.
A Quick Recap: The T-s Diagram for Refrigeration
Remember the T-s diagram from our last chat? It plots Temperature versus Entropy. For a heat-consuming cycle like refrigeration, the path goes counter-clockwise.
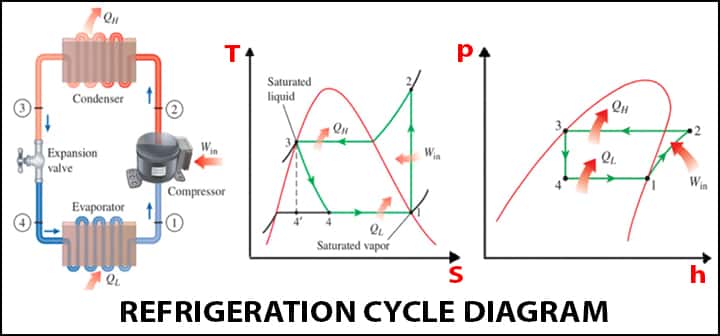
Let's quickly re-trace the four steps on the T-s diagram (middle of the image):
- 1 → 2 (Compression): The refrigerant is compressed, so its temperature and pressure shoot up. Ideally, this is isentropic (constant entropy), so it's a vertical line upwards.
- 2 → 3 (Condensation): The hot gas rejects heat to the room at constant pressure. It first cools down (superheated region) and then condenses into a liquid inside the dome.
- 3 → 4 (Expansion): The high-pressure liquid goes through the expansion valve. This is a throttling process where pressure and temperature plummet. It's irreversible, so entropy increases.
- 4 → 1 (Evaporation): The cold liquid-vapor mix absorbs heat from the fridge at constant pressure, boiling into a saturated vapor. This is the horizontal line inside the dome at the bottom.
The T-s diagram is useful, especially because the area under the bottom line (4 to 1) represents the heat absorbed from the fridge. But for practical analysis, engineers prefer a different map.
Introducing the Engineer's Choice: The P-h Diagram
Now, let's turn our attention to the main event: the Pressure-Enthalpy (P-h) diagram.
Why a new diagram? Think about the main jobs of the refrigeration cycle: absorbing heat in the evaporator and rejecting heat in the condenser. Both of these are constant-pressure processes. And if you recall from our work on open systems, the energy transfer in a steady-flow device at constant pressure is directly related to the change in enthalpy ().
The P-h diagram puts these two key variables on the axes:
- The vertical (y) axis is Pressure (), often on a logarithmic scale to show large pressure changes clearly.
- The horizontal (x) axis is specific Enthalpy ().
This setup is brilliant because the main energy transfers—the refrigerating effect and the heat rejection—can be read directly as simple horizontal distances on the chart! This makes it incredibly powerful for design and analysis.
Let's get acquainted with this new map.
THERMODYNAMICS OF THE REFRIGERATION CYCLE
This document from GUNT, a manufacturer of engineering training equipment, provides a great introduction to why the P-h diagram is so important for refrigeration.
Please read the section titled 'The log p-h diagram for refrigerant'. It explains the layout of the diagram and highlights why it's better suited for refrigeration than the T-s diagram. Focus on the idea that energy flows can be read directly as horizontal lines.
Mapping the Refrigeration Cycle on the P-h Diagram
Now let's trace our refrigerant's journey on this new map. We'll build the cycle step-by-step. The following video is an excellent guide, showing how the physical process in each component translates to a line on the P-h diagram.
Refrigeration - Schematic and a Pressure Enthalpy Chart
This video from Prof. R. Paul Singh builds the P-h diagram for the ideal refrigeration cycle from scratch. It clearly explains what happens in each component and how that translates to the diagram's shape.
Watch from the beginning to 6:21. Pay close attention to how each of the four processes (evaporation, compression, condensation, expansion) is represented as a specific path on the diagram and why it has that shape.
Great, let's summarize what we saw in the video, walking through the cycle just as an engineer would.

Process 4 → 1: Evaporation (Heat Absorption)
- The refrigerant enters the evaporator at state 4 as a low-pressure, cold liquid-vapor mixture.
- As it absorbs heat from the refrigerated space, it boils at constant pressure.
- On the P-h diagram, this is a horizontal line moving to the right at the low "evaporator pressure". It moves right because its enthalpy is increasing as it absorbs energy.
- The length of this line, , represents the refrigerating effect—the amount of heat absorbed per kilogram of refrigerant.
Process 1 → 2: Compression (Work Input)
- At state 1, the refrigerant is a low-pressure saturated vapor. It enters the compressor.
- The compressor does work on the gas, raising its pressure and temperature significantly. For an ideal compressor, this is an isentropic (constant entropy) process.
- On the P-h diagram, this is a curve moving up and to the right. It goes up because pressure increases, and it goes right because the work done on the gas increases its enthalpy. The line follows a curve of constant entropy.
- The refrigerant leaves at state 2 as a high-pressure, hot, superheated vapor.
Process 2 → 3: Condensation (Heat Rejection)
- The hot gas from the compressor flows into the condenser coils on the back of the fridge.
- It rejects heat to the warmer kitchen air at constant pressure.
- On the P-h diagram, this is a horizontal line moving to the left at the high "condenser pressure". It moves left because its enthalpy is decreasing as it gives away energy.
- The refrigerant first cools down to its saturation temperature (de-superheats) and then condenses completely, leaving at state 3 as a high-pressure saturated liquid.
Process 3 → 4: Expansion (Throttling)
- The high-pressure liquid at state 3 is forced through the narrow expansion valve.
- This is a throttling process, which causes a massive pressure drop. The key characteristic of an ideal throttling process is that it is isenthalpic—the enthalpy remains constant ().
- On the P-h diagram, this is a straight vertical line downwards. It's vertical because enthalpy is on the x-axis, and it's not changing. The pressure drops from the high condenser pressure to the low evaporator pressure.
- The cycle is now complete, and the refrigerant at state 4 is ready to absorb heat again.
Test your understanding!
-
On a P-h diagram for a refrigeration cycle, which process is represented by a vertical line, and what does this signify about the enthalpy?
Show answer
The expansion process through the throttling valve (Process 3 → 4) is represented by a vertical line. This signifies that the process is **isenthalpic**, meaning the enthalpy at the end of the process is the same as the enthalpy at the beginning ($h_3 = h_4$).
-
Imagine you have two refrigerators. On their P-h diagrams, Refrigerator A has a longer horizontal line for the evaporation process (4 → 1) than Refrigerator B. What does this tell you about the amount of cooling each refrigerator can provide per kilogram of refrigerant?
Show answer
A longer horizontal line for the evaporation process means a larger change in enthalpy ($h_1 - h_4$). Since this enthalpy change represents the heat absorbed from the cold space (the refrigerating effect), **Refrigerator A can provide more cooling per kilogram of refrigerant** than Refrigerator B.
-
Why isn't the compression process (1 → 2) a vertical line on the P-h diagram?
Show answer
A vertical line on a P-h diagram means constant enthalpy. The compressor's job is to do work *on* the refrigerant to increase its pressure. This work adds energy to the refrigerant, so its enthalpy must increase. Therefore, the line must move to the right (increasing enthalpy), not be vertical.
Conclusion
Excellent session today! We've successfully translated the physical process of refrigeration into the standard diagrams used by engineers. We've seen how these "maps" give us a powerful visual understanding of what's happening to the refrigerant at every stage of its journey.
Key Takeaways:
- The refrigeration cycle is a counter-clockwise loop on both T-s and P-h diagrams.
- While the T-s diagram is useful, the P-h diagram is the practical tool for refrigeration analysis.
- On a P-h diagram:
- Evaporation and condensation are horizontal lines (constant pressure).
- Expansion through a throttling valve is a vertical line (constant enthalpy).
- Compression is a curve moving up and to the right (increasing pressure and enthalpy).
- The key energy transfers can be read directly from the P-h diagram's x-axis:
- Refrigerating Effect () =
- Heat Rejected () =
- Work Input () =
Preview of the Next Lesson
Now that we can confidently read these diagrams and identify the enthalpy at each key state, we are perfectly set up for our next task. In the next lesson, we will analyze the performance of a refrigeration cycle by calculating its Coefficient of Performance (COP). We'll use the enthalpy values from the P-h diagram to finally put a number on how efficiently a refrigerator moves heat. Get ready to do some calculations