Hello again! It’s great to connect for our next session.
In our last lesson, we defined the crucial concepts of saturation temperature, saturation pressure, and latent heat. We learned that during a phase change, like boiling, a substance's temperature and pressure are locked together, and a massive amount of "hidden" energy is needed to turn the liquid into a gas.
Today, we're going to take those ideas and create visual roadmaps. We'll learn how to interpret the three most important charts in this field: the Temperature-Specific Volume (T-v), Pressure-Specific Volume (P-v), and Pressure-Temperature (P-T) diagrams. These diagrams are your essential guides to understanding the state of a pure substance. Mastering them will allow you to see, at a glance, whether you have a liquid, a gas, or a mix of both.
Let's start building these maps.
The T-v Diagram: Mapping Temperature vs. Volume
Let's go back to our trusty piston-cylinder device filled with water, which we're heating at a constant pressure of 1 atmosphere (about 100 kPa). We're going to plot what happens on a graph with Temperature on the y-axis and specific volume (volume per kg, ) on the x-axis.
The following video walks through this exact experiment. It's a fantastic visual guide for how this diagram is built, step-by-step.
Lecture 30: Properties of a Pure Substance: T-v, p-v, p-T diagrams and PVT Surface
This lecture from Bahga Lab IIT Delhi shows precisely how we construct a T-v diagram by observing our constant-pressure heating experiment.
Watch from the beginning (around 1:08) to 10:05. The first part sets up the familiar piston-cylinder experiment. The second part traces the path on the T-v diagram as the water heats up, boils, and becomes steam.
Let's break down the journey you just saw on the T-v diagram:
- Compressed Liquid Region (or Subcooled Liquid): We start with liquid water at, say, 20°C. As we add heat, its temperature rises, and its specific volume increases just a tiny bit. On the graph, this is a very steep upward line. We call it "compressed" or "subcooled" because it's a liquid at a temperature below its boiling point for that pressure.
- Saturated Liquid Point: The water reaches its boiling point (100°C at 1 atm). At this exact moment, it's all still liquid, but it's ready to start boiling. This point lies on a line we call the Saturated Liquid Line.
- Saturated Liquid-Vapor Mixture Region: As we continue adding heat, the magic happens. The water starts to boil, turning into steam. The temperature stays locked at 100°C, but the specific volume shoots up dramatically because steam takes up way more space than liquid water. This phase-change process traces a horizontal line on the T-v diagram. Any point on this line represents a mixture of liquid and vapor.
- Saturated Vapor Point: The last drop of liquid finally boils away. We now have a cylinder full of pure steam, still at 100°C. This point lies on a line we call the Saturated Vapor Line.
- Superheated Vapor Region: If we keep adding heat, the steam's temperature starts to rise again, past 100°C. The volume also continues to expand. We call this "superheated" steam because it's a vapor at a temperature above its boiling point.
The Vapor Dome and the Critical Point
That was just one experiment at one pressure. What if we did it all again, but at a higher pressure, say inside a pressure cooker?
As we learned, at higher pressures, water boils at a higher temperature. On the diagram, this would create another line, similar to the first one but higher up and shorter.
If we run this experiment at many different pressures and connect all the "saturated liquid" points and all the "saturated vapor" points, we create a dome shape.
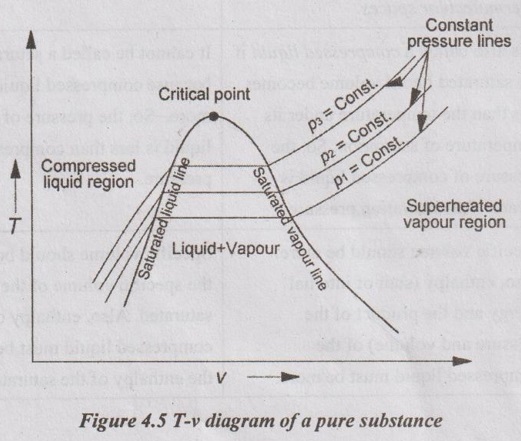
This dome, often called the vapor dome or saturation dome, is the centerpiece of our map. The line on the left is the saturated liquid line, and the line on the right is the saturated vapor line.
Now, what happens at the very top of the dome? This special point is called the Critical Point.
The following clip continues the previous video and explains how the vapor dome is formed and what the critical point signifies.
Lecture 30: Properties of a Pure Substance: T-v, p-v, p-T diagrams and PVT Surface
Let's see how repeating the experiment at higher pressures builds the vapor dome and leads us to the critical point.
Please watch from 10:05 to 14:45. Focus on how the phase-change region (the horizontal line) shrinks as pressure increases, eventually disappearing at the critical point.
As the video explained, at the critical point, the properties of the liquid and vapor phases become identical. There is no longer a distinct boiling process. Above this point, we have a supercritical fluid, a unique state of matter. For water, this happens at a crushing pressure of 22.09 MPa and a temperature of 374.14°C.
The P-v Diagram: A Different Perspective
We can also map out the states of water using Pressure and Specific Volume. To build this diagram, let's imagine a different experiment. This time, we'll keep the temperature constant and compress the steam.
Lecture 30: Properties of a Pure Substance: T-v, p-v, p-T diagrams and PVT Surface
This section of the same lecture shows how to build a P-v diagram by imagining a constant-temperature compression process.
Watch from 14:45 to 20:31. Notice how the process of condensation (vapor to liquid) now appears as a horizontal line on this diagram as well, because both pressure and temperature are constant during phase change.
The P-v diagram has a similar dome shape, but the regions are arranged a bit differently.
- The superheated vapor region is to the right of the dome.
- The compressed liquid region is to the left.
- The saturated liquid-vapor mixture is under the dome.
The lines of constant temperature, called isotherms, are the ones that trace the path on this diagram. They are horizontal within the dome, again reinforcing that for a saturated mixture, pressure is fixed for a given temperature.
The P-T Diagram: The Simplest Map of All
The T-v and P-v diagrams are great for seeing how volume changes, but if all we want to know is which phase we're in (solid, liquid, or gas), the P-T diagram is the best tool. It's often just called a phase diagram.
This diagram doesn't show volume. Instead, it shows the boundary lines where phase changes occur.
Lecture 30: Properties of a Pure Substance: T-v, p-v, p-T diagrams and PVT Surface
Finally, let's look at the P-T diagram. This video explains how the phase change lines are plotted and introduces the triple point.
Watch from 23:48 to 29:53. Pay close attention to the three main lines and the special point where they all meet.
Here are the key features of the P-T diagram:
- Vaporization Curve: This is the line separating the liquid and vapor phases. It's the plot of saturation pressure vs. saturation temperature. This line ends at the critical point, because above it, there's no distinction between liquid and vapor.
- Sublimation Curve: This line separates the solid and vapor phases.
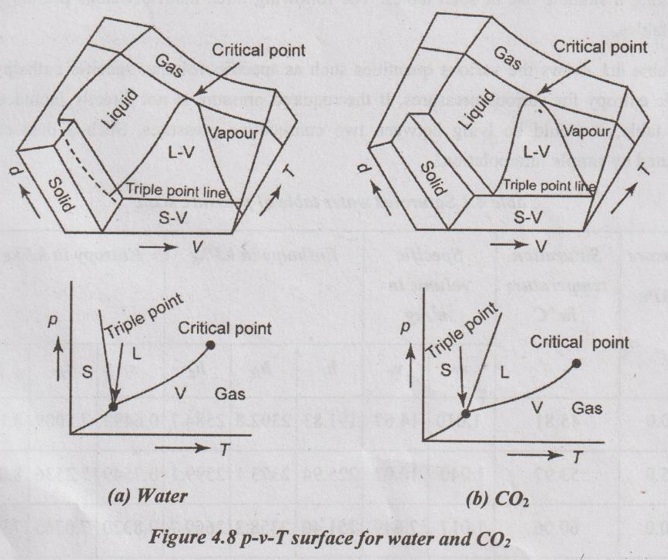
- Fusion Curve: This line separates the solid and liquid phases. For most substances, this line slopes up and to the right. But for water, it uniquely slopes up and to the left. This is because water expands when it freezes (ice is less dense than liquid water). This is why ice floats! Increasing the pressure on ice can actually cause it to melt, even below 0°C.
- Triple Point: This is the single, unique point where all three curves intersect. At this exact temperature and pressure (0.01°C and 0.6117 kPa for water), solid, liquid, and vapor can all exist together in equilibrium.
The Big Picture: The P-v-T Surface
You might have noticed that all these diagrams are related. In fact, they are all just 2D "shadows" of a single, complex 3D surface plotted in Pressure-Volume-Temperature space. Every possible equilibrium state of a pure substance lies somewhere on this surface.
Lecture 30: Properties of a Pure Substance: T-v, p-v, p-T diagrams and PVT Surface
To tie everything together, this last clip shows the 3D P-v-T surface and how our 2D diagrams are simply different views (projections) of it.
Watch from 31:44 to 35:24. This helps unify all the diagrams we've just learned about into a single concept.
Thinking of the diagrams as different projections of this one surface is a powerful way to understand that they are all describing the same substance, just from different points of view.
Let's Recap and Test Your Understanding
Whew, that was a lot of new visual information! Let's pause and make sure it's all sinking in. We've created three "maps" to navigate the states of a pure substance.
- The T-v diagram shows temperature vs. specific volume, with lines of constant pressure (isobars).
- The P-v diagram shows pressure vs. specific volume, with lines of constant temperature (isotherms).
- The P-T diagram (or phase diagram) shows the boundaries between the solid, liquid, and vapor phases.
Now, let's test your map-reading skills.
Test your understanding!
-
On a T-v diagram, a state is located to the right of the vapor dome. What is the phase of the substance?
Show answer
It is in the **superheated vapor** region. This means it is a gas at a temperature higher than its boiling point for that pressure. -
You have water in a sealed container at the triple point. What would you observe inside?
Show answer
You would see all three phases existing at the same time: solid ice, liquid water, and water vapor (steam). -
Why can't you turn a gas into a liquid by just compressing it (increasing pressure) if its temperature is above the critical temperature?
Show answer
If you look at a P-v or T-v diagram, the isotherm (constant temperature line) for a temperature above the critical temperature never passes through the vapor dome. It stays entirely in the superheated vapor / supercritical fluid region. Since it never enters the two-phase region, condensation never occurs, no matter how high you raise the pressure. -
On the P-T diagram for water, you are on the fusion curve. If you increase the pressure while keeping the temperature constant, what happens to the ice?
Show answer
Because the fusion curve for water has a negative slope, increasing the pressure at a constant temperature will move you from the solid (ice) region into the liquid region. The ice will melt. This is how ice skates work: the high pressure under the blade melts a thin layer of ice, providing lubrication.
Conclusion
Fantastic work today! You've just learned to read the fundamental maps of thermodynamics. These diagrams aren't just pretty pictures; they are powerful tools that summarize the entire behavior of a pure substance. Being able to sketch them and identify the different regions is a critical skill for solving problems.
Key Takeaways:
- T-v and P-v diagrams show the relationship between temperature, pressure, and volume, and are defined by the vapor dome.
- The regions on these diagrams are compressed liquid, saturated liquid-vapor mixture (inside the dome), and superheated vapor.
- The P-T diagram shows the boundaries between solid, liquid, and vapor phases. Its key features are the vaporization, fusion, and sublimation curves, which meet at the triple point.
- The critical point is the state above which liquid and vapor are indistinguishable.
Preview of the Next Lesson
We can now read the maps and know which "region" we are in. But what if we are inside the vapor dome? How do we describe a mixture that is, say, 20% vapor and 80% liquid? In our next lesson, we will define the concept of quality (or dryness fraction) to do just that. This will be our final step before we dive into the steam tables—the numerical data behind these diagrams—to start solving real engineering problems.