Hello! In our last lesson, we saw how the derivative gives us the gradient (slope) of a tangent line. We're now going to take that idea a step further. Instead of looking at the gradient at just one point, we'll look at where the gradient is positive or negative over entire intervals. This will tell us where the function itself is "going uphill" (increasing) or "downhill" (decreasing).
This lesson is your next step in using calculus to understand and describe the behaviour of functions. By the end of our session, you'll be able to determine the exact intervals where a function is increasing or decreasing by using its first derivative.
1. The Sign of the Derivative and the Shape of the Graph
Let's start with the core principle. In the previous lesson, we established that is the gradient of the function at point .
- A positive gradient means the function is rising as you move from left to right.
- A negative gradient means the function is falling as you move from left to right.
Therefore, we can establish a simple but powerful set of rules:
- If over an interval, the function is increasing on that interval.
- If over an interval, the function is decreasing on that interval.
- If , the function has a stationary point. These are the points where the function is momentarily "flat" and often mark the transition between an increasing and a decreasing section. We will explore these points in detail in the next lesson.
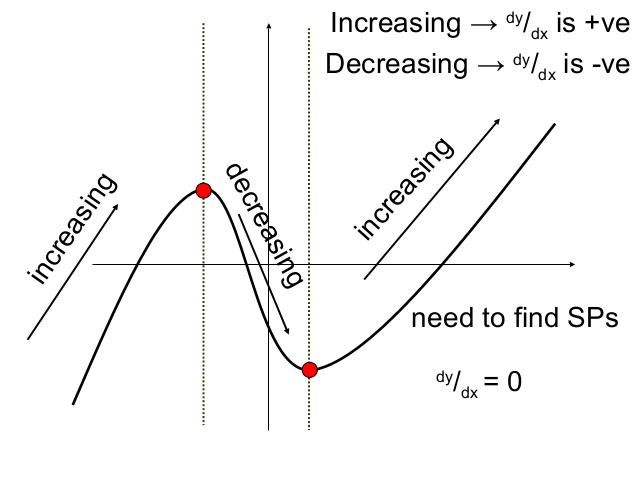
This image provides a great visual summary of this relationship.
2. The Method for Finding Intervals
To find the intervals where a function is increasing or decreasing, we follow a systematic process. The goal is to find the "critical values" where the function might change direction (the stationary points) and then test the regions between them.
The general steps are:
- Differentiate the function to find the gradient function, .
- Find the critical values by setting the derivative equal to zero and solving for . That is, solve the equation .
- Determine the sign of in the intervals created by these critical values. There are two common ways to do this:
- Sketching the derivative: If is a simple function (like a linear or quadratic function), you can sketch its graph to see where it is above or below the x-axis.
- Testing points: Choose a test value from each interval and substitute it into to see if the result is positive or negative.
Let's watch a video that demonstrates this entire process clearly. The presenter uses the sketching method to solve the inequality.
Differentiation : Increasing & Decreasing Functions : ExamSolutions
This video from ExamSolutions provides an excellent, detailed walkthrough of finding the intervals where a function is increasing. It covers finding the derivative, setting up the inequality, and solving the resulting quadratic inequality by finding critical values and sketching the graph of the derivative.
Watch from 01:21 to 05:41. This segment covers the core procedure: differentiating the function, setting up the inequality, finding the critical values, and using a sketch of the derivative to determine the solution.
As you saw, solving the inequality (e.g., ) is key. Your knowledge of solving quadratic inequalities from earlier modules is directly applicable here.
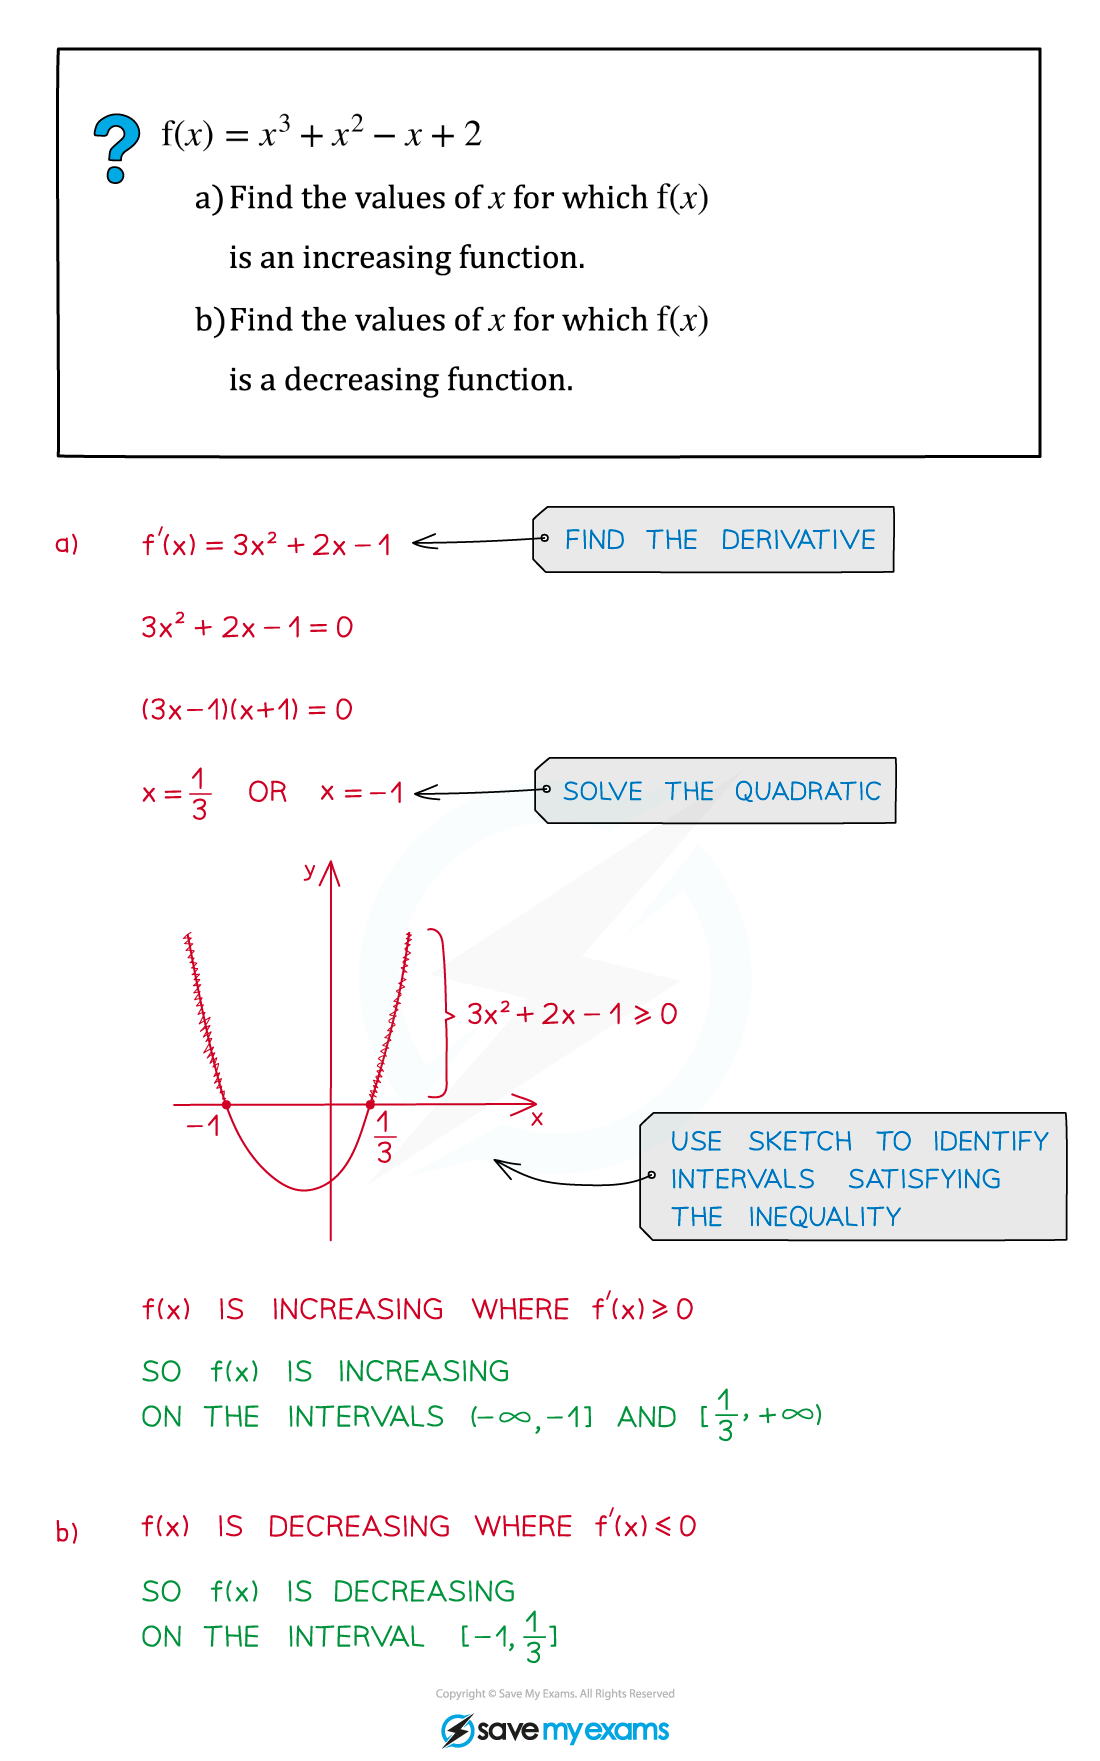
Here is a static image that summarises the same step-by-step process.
3. An Alternative: The Nature Table
Another way to determine the sign of the derivative in each interval is to use a "nature table". This involves picking a test value from each interval and plugging it into the derivative. This method can feel more direct if you are less comfortable sketching the derivative's graph.
Increasing and decreasing functions - Differentiation
The following resource from BBC Bitesize demonstrates this 'testing points' method using a table.
Read 'Example 2' on this page. Notice how they first find the stationary points at x=0 and x=2. Then, they create a table and test x-values to the left, between, and to the right of these points (e.g., x=-1, x=1, x=3) to find the sign of dy/dx in each region.
Both methods—sketching the derivative or using a nature table—are valid. You can use whichever you prefer.
Test your understanding!
Find the intervals in which the function is increasing and decreasing.
Show answer
-
Differentiate:
-
Find critical values: Set .
The critical values are and . -
Test intervals: The critical values divide the number line into three intervals: , , and .
- For , let's test :
. Since , the function is increasing on . - For , let's test :
. Since , the function is decreasing on . - For , let's test :
. Since , the function is increasing on .
- For , let's test :
Conclusion:
- The function is increasing for and .
- The function is decreasing for .
4. Proving a Function is Always Increasing or Decreasing
Sometimes, a function may always be increasing or always decreasing. In these cases, the derivative will always be positive or always be negative (with the possibility of being zero at isolated points). To prove this, we can use techniques like completing the square or the discriminant, which you may recall from our work with quadratics.
Differentiation (Increasing and Decreasing Functions)
First, let's see an example of a function that is always increasing. This video from 1st Class Maths shows how to prove this by completing the square on the derivative to show it can never be negative.
Watch the first worked example, from 01:53 to 03:40.
Now, let's look at an example of proving a function is always decreasing.
Increasing and Decreasing Functions – A Level Maths Revision
This resource from Twinkl demonstrates how to show a function is always decreasing. The key is to show that the derivative (which is a quadratic) is always negative. This is done by checking that it has a negative leading coefficient and that its discriminant is negative, meaning it never crosses the x-axis.
Read 'Example Question 3' on this page. Follow the logic of how the discriminant (b² - 4ac) is used to prove that the derivative is always negative.
These techniques are powerful because they allow us to make a statement about the function's behaviour across its entire domain without having to test infinite intervals.
Conclusion
Today, you've added another fundamental application of differentiation to your skills. You can now analyse a function's derivative to describe where the original function is rising and falling.
Key Takeaways:
- A function is increasing where its derivative is positive.
- A function is decreasing where its derivative is negative.
- The standard procedure is to differentiate, find the critical values by solving , and then test the intervals between those values.
- You can prove a function is always increasing or decreasing by showing its derivative is always positive or always negative, often using techniques like completing the square or the discriminant.
In our next lesson, we will focus on the stationary points themselves—those points where . These are the peaks and valleys of the graph, known as local maxima and minima, and learning to classify them is the next logical step in sketching and understanding functions.