Hello! In our previous lesson, we established that a logarithm is the inverse of an exponential function. We learned that the statement is equivalent to , and that being able to convert between these forms is the foundational skill for working with logarithms.
Today, we will build directly on that foundation. Our goal is to evaluate logarithmic functions and analyse (analyze) their graphs and properties. We will first use the conversion technique to find the value of logarithmic expressions. Then, we will explore the visual characteristics of logarithmic functions by graphing them and identifying their key features, such as their domain, range, and asymptotes.
1. Evaluating Logarithmic Functions
The key to evaluating any logarithm is to ask the right question, which is made easier by converting from logarithmic to exponential form. For an expression like , the question is: "To what power must we raise the base to get the number ?"
Let's say we want to evaluate . We can set this equal to an unknown, :
Converting this to its equivalent exponential form gives:
From your knowledge of indices (powers), you know that , so . Therefore, . This same method works for all types of logarithms, including those that result in fractional or negative values.
Introduction to Logarithms (Part 1) | Logarithms | A-Level Maths Series
The following video from The GCSE Maths Tutor, 'Introduction to Logarithms', demonstrates how to solve for any missing part of a logarithmic expression by converting it to an exponential equation. It also shows how to use your calculator for more complex cases.
Please watch from 04:11 to the end (15:27). The first part (04:11 - 11:52) works through several examples where the unknown is the base, the argument, or the power. The second part (11:52 - 15:27) shows how to use the log button on a scientific calculator to evaluate logarithms that don't have simple integer answers.
As the video shows, the core idea is always to rearrange the equation into the more familiar exponential form. A solid grasp of the rules of indices (negative and fractional powers) is essential for this.
Test your understanding!
Find the value of the following logarithmic expressions without using a calculator. For each one, think about the question it is asking.
Show answer
- Question: "5 to what power gives 125?"
Solution: , so . - Question: "16 to what power gives 4?"
Solution: , and the square root is equivalent to an index (power) of . So, , which means . - Question: "3 to what power gives ?"
Solution: First, . A negative index creates a reciprocal, so . Therefore, . - Question: "7 to what power gives 1?"
Solution: Any number raised to the power of 0 is 1. So, , which means .
2. Graphing Logarithmic Functions
Since logarithmic functions are the inverses of exponential functions, their graphs are reflections of each other across the line . This fact provides a straightforward way to graph them.
To graph a function like , it's easiest to:
- Convert the equation to its exponential form: .
- Choose values for (e.g., -2, -1, 0, 1, 2).
- Calculate the corresponding values.
- Plot the resulting coordinates.
Evaluate and Graph Logarithmic Functions
The following online textbook chapter, 'Evaluate and Graph Logarithmic Functions', provides an excellent, detailed walkthrough of this graphing process. It covers cases where the base is greater than 1 and where it's between 0 and 1.
Please read the section titled 'Graph Logarithmic Functions'. Start by looking at the example 'Graph y = log_2(x)' and follow the method of creating a table of values. Then, review the examples for other bases, including those where the base is a fraction like 1/3.
The shape of a logarithmic graph depends on its base, . Let's examine the two main cases.
Case 1: Base (e.g., , )
When the base is greater than 1, the function is increasing. As increases, also increases. The graph rises from the bottom left to the top right, but its steepness decreases as gets larger.

Case 2: Base (e.g., , )
When the base is a fraction between 0 and 1, the function is decreasing. As increases, decreases. The graph falls from the top left to the bottom right.
3. Properties of Logarithmic Functions
By analysing these graphs, we can identify several key properties that all logarithmic functions share. These are essentially "mirror images" of the properties of exponential functions.
- Domain: The graph never touches or crosses the y-axis; it only exists for positive values of . The domain is . This is a critical property: you can only take the logarithm of a positive number.
- Range: The graph extends infinitely upwards and downwards. The range is all real numbers, .
- Vertical Asymptote: The graph gets infinitely close to the y-axis but never touches it. The line (the y-axis) is a vertical asymptote.
- x-intercept: All logarithmic graphs pass through the point . This is because for any valid base , since .
- Key Point: All logarithmic graphs pass through the point . This is because for any valid base , since .
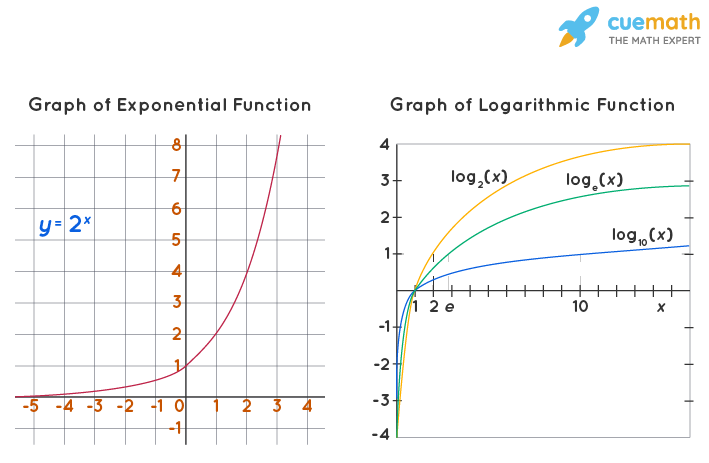
The resource you read, "Evaluate and Graph Logarithmic Functions", contains excellent summary tables of these properties, which are worth reviewing.
Test your understanding!
Consider the function . Without graphing it, state:
- Its domain and range.
- The equation of its vertical asymptote.
- Its x-intercept.
- Another point that must be on the graph.
Show answer
- Domain: . Range: .
- Vertical Asymptote: .
- x-intercept: .
- Another point: Since the base is 4, the graph must pass through .
Conclusion
In this lesson, you have learned how to find the value of logarithmic functions and how to analyse their graphical behaviour.
Key Takeaways:
- To evaluate a logarithm like , you can set it equal to and solve the equivalent exponential equation .
- The graph of a logarithmic function can be plotted by converting it to , choosing -values, and finding the corresponding -values.
- Logarithmic functions have a domain of and a range of .
- They always have a vertical asymptote at and an x-intercept at .
- The shape of the graph depends on the base: it is increasing if and decreasing if .
Preview of the Next Lesson:
Now that we understand the fundamental properties of logarithmic functions, we can move on to manipulating expressions involving them. In the next lesson, we will learn the properties of logarithms (also known as the laws of logarithms), which will allow us to expand and condense complex logarithmic expressions. These rules are the logarithmic equivalent of the index laws you already know.