Hello!
In our last lesson, we explored how to analyse a polynomial's end behaviour and its turning points. We saw that the leading term dictates what the graph does on its far-left and far-right edges, and that a polynomial of degree can have at most "hills" and "valleys". We also had a brief preview of how the multiplicity of a root affects the graph's behaviour at the x-axis.
Today, we will synthesise all the concepts we've learned over the past few lessons to achieve our learning outcome: Sketch the graph of a polynomial function by synthesising (synthesizing) its key features. We will assemble the pieces—intercepts, end behaviour, and root multiplicity—to create a complete and accurate sketch of a polynomial's graph.
By the end of this lesson, you'll have a systematic process for taking a polynomial in factorised form and drawing its corresponding graph.
1. The Method: A Step-by-Step Guide to Sketching Polynomials
Sketching a polynomial is like solving a puzzle. We have several clues (the key features), and our task is to assemble them into a single, coherent picture. Here is a systematic process you can follow every time.
A 5-Step Process for Graphing a Polynomial
- Find the y-intercept: This is the point where the graph crosses the y-axis. You can find it by calculating (i.e., substituting into the function).
- Find the x-intercepts (Roots): These are the points where the graph crosses or touches the x-axis. For a polynomial in factorised form, you can find them by setting each factor to zero and solving for .
- Analyse the Multiplicity of the Roots: Look at the power (exponent) of each factor.
- Odd multiplicity (1, 3, 5, ...): The graph crosses the x-axis at this root.
- Even multiplicity (2, 4, 6, ...): The graph touches the x-axis at this root and "bounces" back.
- Determine the End Behaviour: Use the Leading Term Test from our previous lesson.
- Find the degree () of the polynomial by summing the multiplicities of the roots.
- Find the sign of the leading coefficient ().
- Use the degree (even/odd) and sign (positive/negative) to determine if the graph rises or falls on the far left and far right.
- Sketch the Graph:
- Mark the intercepts on your axes.
- Start drawing from the far left, following the end behaviour.
- Connect the intercepts, making sure the graph crosses or bounces correctly according to the multiplicity of each root.
- Ensure the finished sketch is a smooth curve that matches the end behaviour on the right and does not have more than turning points.
The following resource provides a detailed walkthrough of this process with excellent examples. It uses the American term "zeros" for "roots", but the method is identical.
Algebra - Graphing Polynomials
This guide, 'Graphing Polynomials' from Paul's Online Math Notes, formalises the process we just outlined. It's a great reference to see the steps applied to several examples.
Read through the 'Process for Graphing a Polynomial' and follow along with the two examples provided. Pay close attention to how the author combines information about the roots, their multiplicities, and the end behaviour to create the sketch.
2. Seeing it in Action: Video Walkthroughs
Now that you have the step-by-step process, let's watch it being applied. These videos will help solidify your understanding, especially regarding the behaviour at the roots.
This first video uses British terminology and provides a quick, clear introduction to sketching polynomials that are already factorised.
11. Sketching factorised polynomials. Additional Maths OCR FSMQ
The video 'Sketching factorised polynomials' by BareauMaths demonstrates the core concepts of finding roots and using end behaviour to sketch quartic and cubic graphs. It's a great starting point.
Watch from 04:32 to 07:20 to see how a positive quartic polynomial is sketched from its four distinct roots. Then, watch from 08:07 to 11:56 to see how a repeated root (multiplicity 2) creates a 'bounce' on the axis for a cubic function.
The BareauMaths video did an excellent job showing what happens for multiplicities of 1 (cross) and 2 (bounce). What happens for higher multiplicities? The next video elaborates on this.
How To Graph Polynomial Functions Using End Behavior, Multiplicity & Zeros
The video 'How To Graph Polynomial Functions Using End Behavior, Multiplicity & Zeros' by The Organic Chemistry Tutor gives a more detailed look at multiplicity.
First, watch from 09:41 to 11:40. This part explains the key difference in behaviour for multiplicities 1, 2, and 3. Notice that for multiplicity 3, the graph crosses the axis, but it 'flattens out' as it does so. Then, watch the detailed worked example from 11:40 to 17:50 to see the full sketching process in action for a degree-4 polynomial.
Key Distinction in Multiplicity:
- Multiplicity 1: Crosses the x-axis (like a line).
- Multiplicity 2: Touches the x-axis and bounces off (like a parabola's vertex).
- Multiplicity 3: Crosses the x-axis, but flattens horizontally as it passes through (like the graph of at the origin).
3. Let's Sketch One Together
Let's apply the 5-step process to a new function: .
-
Find the y-intercept:
- Set : .
- The y-intercept is at .
-
Find the x-intercepts (Roots):
- Set each factor to zero:
- The roots are at and .
- Set each factor to zero:
-
Analyse the Multiplicity:
- For the root , the factor is . The multiplicity is 2 (even), so the graph will touch and bounce at .
- For the root , the factor is . The multiplicity is 1 (odd), so the graph will cross at .
-
Determine the End Behaviour:
- Degree: The degree is the sum of the multiplicities: . This is an odd degree polynomial.
- Leading Coefficient: Imagine expanding the expression: . The leading term would be . The coefficient is , which is positive.
- Conclusion: For an odd degree, positive leading coefficient polynomial, the end behaviour is Falls Left, Rises Right.
-
Sketch the Graph:
- Plot the intercepts: , , and .
- Start from the far left (falling).
- The graph rises to the first root at and crosses it.
- The graph continues to rise, passing through the y-intercept at .
- It must turn around to come back down to the next root at .
- At , the graph touches the axis and bounces off, heading back up.
- This upward movement matches our "Rises Right" end behaviour.
Here is what the final sketch should look like. Notice it has two turning points, which is the maximum for a degree 3 polynomial ().
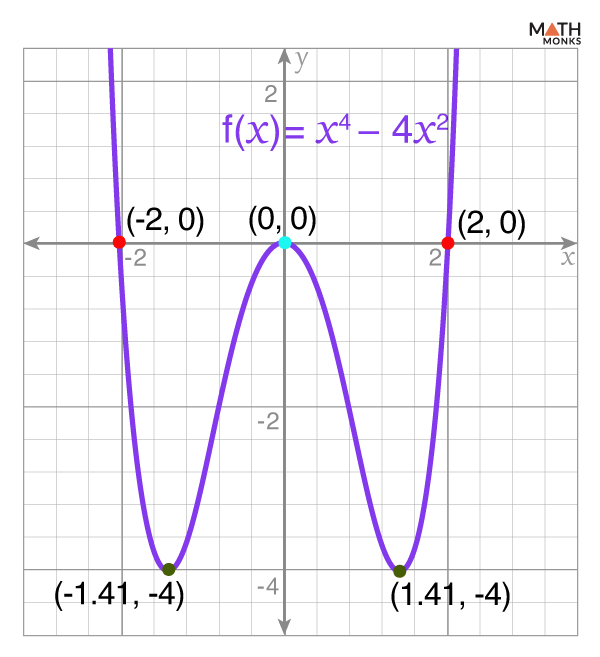
(Correction: A better image representing the specific function would show the bounce at x=1 and the crossing at x=-3. Imagine a curve that does exactly that, passing through y=3.)
Test your understanding!
Use the 5-step process to sketch the graph of the polynomial function . Describe each step in your reasoning.
Show answer
- y-intercept: . The y-intercept is at .
- x-intercepts (Roots): The roots are at , , and .
- Multiplicity:
- : Multiplicity 2 (even) -> Touches and bounces.
- : Multiplicity 1 (odd) -> Crosses.
- : Multiplicity 1 (odd) -> Crosses.
- End Behaviour:
- Degree: (even).
- Leading Coefficient: . The coefficient is negative.
- Conclusion: Even degree, negative leading coefficient -> Falls Left, Falls Right.
- Sketch:
- Start from the bottom left.
- Rise to and cross.
- Turn around, come back to and bounce.
- Turn around again, rise towards and cross.
- After crossing at , the graph turns one last time and heads down, matching the "Falls Right" end behaviour. The sketch will have 3 turning points.
Conclusion
Today we have successfully combined all our analytical tools to build a complete picture of a polynomial function. By following a structured process, you can confidently translate a polynomial's equation into a visual sketch that captures its most important characteristics.
Key Takeaways:
- A reliable 5-step process for sketching polynomials involves finding intercepts, analysing multiplicities, determining end behaviour, and then connecting the points with a smooth curve.
- The multiplicity of a root is your guide for how the graph behaves at the x-axis: odd multiplicity means it crosses, while even multiplicity means it touches and bounces.
- The end behaviour provides the "frame" for your sketch, telling you where the graph starts and ends.
- The number of turning points (at most ) serves as a final check on your sketch's shape.
Preview of the Next Lesson:
We have developed a strong understanding of polynomial functions. Next, we will venture into a related family of functions: rational functions. These are functions formed by dividing one polynomial by another, like . This fractional nature introduces fascinating new graphical features called asymptotes—lines that the graph approaches but never touches. We will learn how to find and analyse these to sketch rational functions.