Hello!
In our last lesson, we developed a powerful algorithm using the Rational Root Theorem to find a polynomial's roots, which correspond to the x-intercepts on its graph. This was a major step in understanding the behaviour of these functions. However, knowing where a graph crosses the x-axis is only part of the story.
Today's lesson addresses the learning outcome: Analyse (analyze) the end behaviour (behavior) and turning points of polynomial functions. We will investigate what the graph does at its extremes—far to the left and far to the right—and what happens in between the roots, where the graph changes direction. By the end of this lesson, you will be able to look at a polynomial's equation and predict the overall shape of its graph.
Let's begin by exploring what happens at the "ends" of the graph.
1. End Behaviour: The Leading Term Test
The end behaviour of a function describes what happens to its y-values as the x-values become extremely large in either the positive () or negative () direction. For polynomials, the end behaviour is determined entirely by the term with the highest power of , known as the leading term. As gets very large, the influence of this single term outweighs all others combined.
To determine the end behaviour, we need to examine two features of the leading term, :
- The degree (): Whether it is even or odd.
- The sign of the leading coefficient (): Whether it is positive or negative.
This gives us four possible combinations, which can be summarised as the Leading Term Test.
The following video provides an excellent explanation of this concept and how it relates to the simple power functions you are already familiar with (like and ).
Multiplicity and End Behavior of Polynomials (Precalculus - College Algebra 29)
In 'Multiplicity and End Behavior of Polynomials', Professor Leonard clearly explains how the leading term dictates the graph's end behaviour. He connects this idea to the shapes of basic even and odd degree power functions.
Please watch from 21:53 to 30:27. Focus on how the degree (even/odd) and the leading coefficient's sign (positive/negative) create four distinct patterns for end behaviour.
As the video explained, these four scenarios determine if the graph rises or falls on the left and right sides. This chart provides a fantastic visual summary:
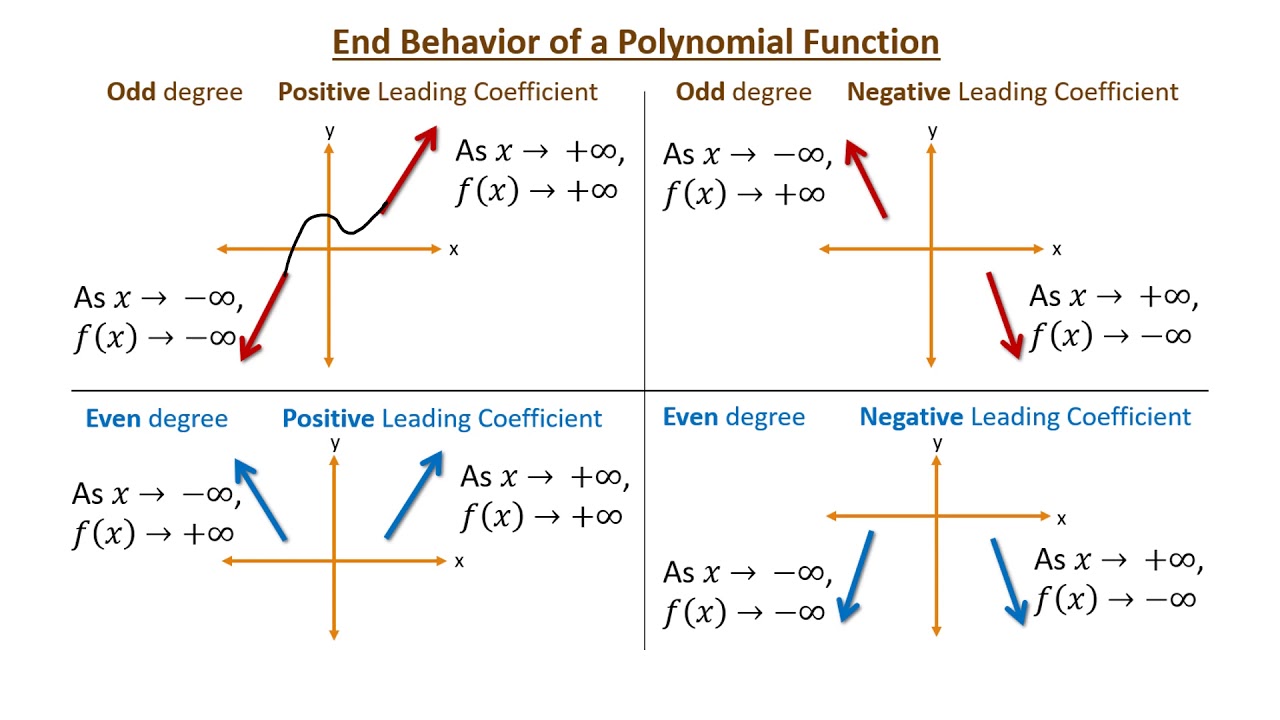
Another way to describe this, which you may see in some texts, is by referencing quadrants. For example, a polynomial with an odd degree and a positive leading coefficient (like ) "extends from Quadrant 3 to Quadrant 1".
Test your understanding!
For each polynomial below, identify the degree, the sign of the leading coefficient, and describe the end behaviour (e.g., "Rises left, Rises right").
- (Be careful with the order!)
Show answer
-
- Degree: 3 (Odd)
- Leading Coefficient: -5 (Negative)
- End Behaviour: Rises left, Falls right.
-
- Degree: 6 (Even)
- Leading Coefficient: 7 (Positive)
- End Behaviour: Rises left, Rises right.
-
- Degree: 5 (Odd)
- Leading Coefficient: -1 (Negative)
- End Behaviour: Rises left, Falls right.
2. Turning Points: The Hills and Valleys
Now that we know what happens at the ends of the graph, let's consider what happens in the middle. The smooth, flowing curves of polynomial graphs have peaks and valleys where they change direction. These are called turning points.
- A turning point where the function changes from increasing to decreasing is a local maximum.
- A turning point where the function changes from decreasing to increasing is a local minimum.
There is a simple and direct relationship between the degree of a polynomial and the number of turning points it can have.
The document 'Polynomial functions' from mathcentre.ac.uk, a UK-based resource, provides a concise and clear explanation of turning points. It uses terminology you are familiar with.
Please read section 4, 'Turning points of polynomial functions'. It clearly defines a turning point and states the rule that connects the degree of a polynomial to the maximum number of turning points it can have.
As the resource stated, the key rule is:
A polynomial of degree has at most turning points.
This is a powerful piece of information. A cubic function (degree 3) can have at most turning points. A quintic function (degree 5) can have at most turning points. It can have fewer, but never more.

To dive a little deeper, let's explore how the parity (evenness or oddness) of the degree affects the number of turning points.
Polynomial Functions: Turning Points
The video 'Polynomial Functions: Turning Points' by The Bearded Math Man offers a clear definition of turning points and discusses the rules governing how many a function can have.
Please watch from 04:47 to 07:34. This segment defines a turning point and explains not only the n-1 rule but also an additional interesting property: odd-degree polynomials have an even number of turning points (0, 2, 4...), while even-degree polynomials have an odd number of turning points (1, 3, 5...).
This parity rule makes sense when you combine it with end behaviour. An even-degree polynomial must start and end going in the same direction (e.g., up and up), so to connect the ends it must change direction an odd number of times. Conversely, an odd-degree polynomial must start and end in opposite directions, requiring an even number of turns.
3. A Quick Look at Behaviour at the Roots: Multiplicity
Finally, let's connect today's topic back to our previous lesson on finding roots. In the last exercise, you found that the polynomial had a "repeated root" at . The exponent on the factor, in this case 2, is called the multiplicity of the root. This number tells us how the graph behaves when it meets the x-axis at that root.
- Odd Multiplicity (e.g., 1, 3, 5...): The graph crosses the x-axis at the root.
- Even Multiplicity (e.g., 2, 4, 6...): The graph touches the x-axis and "bounces" off, returning in the direction it came from.
This concept is explained in the first part of the Professor Leonard video. While not strictly required by today's learning outcome, it is essential for the next step of sketching graphs, so it's useful to see it now.
Multiplicity and End Behavior of Polynomials (Precalculus - College Algebra 29)
Let's return to Professor Leonard's video to understand multiplicity. He explains why an even power causes the graph to 'bounce' and an odd power causes it to 'cross' at a root.
If you have time, I recommend watching from 00:59 to 21:36. The core idea of 'bounce vs. cross' is established in the first few minutes (until about 12:00), with the rest of the segment providing a deeper justification. Understanding this will be very helpful for our next lesson.
Conclusion
In this lesson, we have added two major tools to our polynomial analysis toolkit. By combining them with what we already know about roots, we can now predict the overall shape of a polynomial's graph from its equation alone.
Key Takeaways:
- End Behaviour is determined by the leading term. We look at the degree (even/odd) and the leading coefficient's sign (positive/negative) to know if the graph rises or falls on the far left and right.
- Turning Points are the local maxima and minima where the graph changes direction. A polynomial of degree has at most turning points.
- The number of turning points has the opposite parity to the degree: odd degree functions have an even number of turning points, and even degree functions have an odd number.
Preview of the Next Lesson:
We have all the pieces now: roots (x-intercepts), y-intercept, end behaviour, and turning points. In our next lesson, we will sketch the graph of a polynomial function by synthesising (synthesizing) its key features. We will take a polynomial equation from start to finish and produce a detailed sketch of its graph.