Hello!
In our last lesson, we learned how to synthesise (synthesize) the key features of a polynomial—its intercepts, end behaviour, and the multiplicity of its roots—to create an accurate sketch of its graph. We saw that polynomials are well-behaved, smooth, and continuous functions.
Today, we're moving on to a new family of functions: rational functions. These are functions formed by the division of one polynomial by another. This simple act of division introduces fascinating new behaviours. Our goal for this lesson is to analyse (analyze) rational functions to determine intercepts, asymptotes, and discontinuities.
This process is a bit like being a detective. We'll be given a function, and our job is to uncover all of its hidden features. These features—the function's roots, intercepts, and various types of "breaks" in the graph—are the essential clues we'll need for our next lesson, where we'll sketch the complete graph.
1. What is a Rational Function?
A rational function is any function that can be written as the ratio of two polynomials, , where is not the zero polynomial.
Examples include:
The most important new characteristic of rational functions comes from the denominator. Since division by zero is undefined, we must pay special attention to any x-values that make the denominator, , equal to zero. These values are not in the function's domain and they create discontinuities in the graph.
Watch this brief introduction to get a feel for what these functions and their discontinuities look like.
All of Rational Functions in Under 1 Hour (ultimate study guide) | jensenmath.ca
The video 'All of Rational Functions in Under 1 Hour' by JensenMath starts with a great overview of what rational functions are and the types of discontinuities we'll be looking for.
Watch the first minute (00:00 - 01:08) to understand the definition of a rational function and see examples of the graphical features we're about to analyse: vertical asymptotes and holes.
2. The First Step: Factorise and Find Restrictions
Just as with polynomials, our first step in analysing a rational function is to factorise (factor) the numerator and the denominator completely. This single step is the key that unlocks almost all of the function's secrets.
Once factorised, we can easily see the restrictions on the variable—the x-values that make the denominator zero. These are the locations of our discontinuities.
All of Rational Functions in Under 1 Hour (ultimate study guide) | jensenmath.ca
Let's continue with the JensenMath video to see how to properly factorise and state the restrictions for a rational function.
Watch from 01:08 to 04:50. The narrator walks through two examples, showing how to factorise the numerator and denominator to find the x-values for which the function is undefined.
3. Types of Discontinuities: Vertical Asymptotes and Holes
The restrictions we just found tell us where the graph has breaks, but not what kind of breaks they are. There are two main types:
-
Vertical Asymptotes (Infinite Discontinuities): These are vertical lines that the graph approaches but never touches or crosses. A vertical asymptote occurs at if the factor remains in the denominator after we have simplified the function by cancelling any common factors. This corresponds to a "non-zero divided by zero" situation.
-
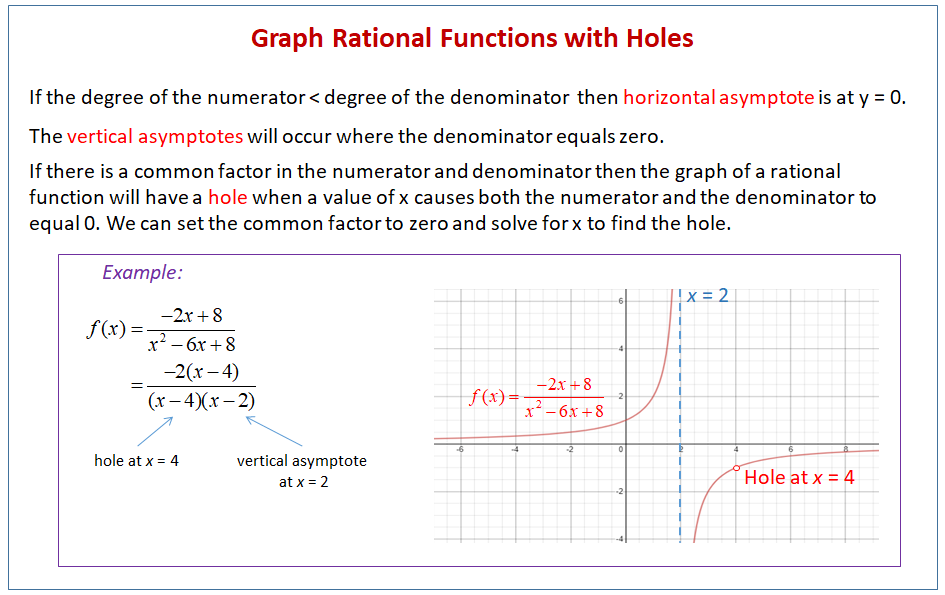
Holes (Removable Discontinuities): These are single points missing from the graph. A hole occurs at if the factor is a common factor in both the numerator and the denominator, and it gets cancelled out during simplification. This corresponds to a "zero divided by zero" situation.
The following text provides a formal definition and method for telling them apart.
The resource 'Rational Functions' from LibreTexts gives a clear, step-by-step guide to distinguishing between vertical asymptotes and removable discontinuities (holes).
Read the sections 'Vertical Asymptotes' and 'Removable Discontinuities'. Pay close attention to the 'How To' box for identifying vertical asymptotes, as it provides a clear procedure for simplifying the function and identifying which factors lead to asymptotes versus holes.
To see this distinction in action, let's return to the JensenMath video, which has excellent examples of both scenarios.
All of Rational Functions in Under 1 Hour (ultimate study guide) | jensenmath.ca
This segment of the JensenMath video will help you see the practical difference between finding a vertical asymptote and finding a hole.
First, watch the section on 'Vertical Asymptotes' (12:27 - 16:15). Then, jump to the section on 'Holes' (24:17 - 28:57). Notice how in one case a factor leads to an asymptote, and in the other, a common factor leads to a hole whose coordinates can be found.
Here is a visual summary of finding a hole:
Test your understanding!
Consider the function . Factorise the function and identify the locations and types of all discontinuities.
Show answer
- Factorise: The numerator is a difference of squares, and the denominator is a standard trinomial.
- Identify Restrictions and Simplify: The denominator is zero when or . We can cancel the common factor .
- Analyse Discontinuities:
- The factor was cancelled. Therefore, there is a hole at .
- The factor remains in the simplified denominator. Therefore, there is a vertical asymptote at .
4. End Behaviour: Horizontal and Slant Asymptotes
Next, we need to understand the function's end behaviour: what happens to the graph as approaches positive or negative infinity ()? For polynomials, the graph would rise or fall forever. For rational functions, the graph will often level off and approach a horizontal or slanting line called a horizontal asymptote or slant (oblique) asymptote.
You can determine which type of asymptote exists by comparing the degree of the numerator () to the degree of the denominator ().
The LibreTexts resource you looked at earlier has a fantastic summary of the three possible cases.
Let's revisit the 'Rational Functions' resource to learn the rules for finding end behaviour asymptotes. The three cases presented here are the foundation for this analysis.
Read the section 'End Behaviour Asymptotes of Rational Functions'. Focus on understanding the three distinct cases based on the degrees of the numerator and denominator. Your background in polynomial long division will be useful for Case 2.
Here is a summary of the rules:
- Case 1: (Bottom-heavy)
- The horizontal asymptote is the line (the x-axis).
- Case 2: (Equal degrees)
- The horizontal asymptote is the line , where and are the leading coefficients of the numerator and denominator, respectively.
- Case 3: (Top-heavy by one)
- There is a slant (oblique) asymptote. You find its equation by performing polynomial division. The asymptote is the line defined by the quotient (you can ignore the remainder).
The following video segments show worked examples for each of these cases.
All of Rational Functions in Under 1 Hour (ultimate study guide) | jensenmath.ca
Seeing these rules applied will help solidify them. Let's watch the sections from the JensenMath video on horizontal and slant asymptotes.
Watch the section on 'Horizontal Asymptotes' (16:15 - 21:17), which covers the first two cases. Then, watch the section on 'Slant Asymptotes' (21:17 - 24:17) to see how polynomial division reveals the equation of the slanted line.
5. Finding the Intercepts
The final pieces of our analysis are the intercepts. This process is very similar to what we did with polynomials.
- y-intercept: To find where the graph crosses the y-axis, we evaluate the function at . Simply calculate . If the function is undefined at (i.e., it's a vertical asymptote), there is no y-intercept.
- x-intercepts (Roots): To find where the graph crosses the x-axis, we set the function equal to zero and solve for . A fraction is equal to zero only when its numerator is zero. So, we set the numerator of the simplified function equal to zero to find the roots.
All of Rational Functions in Under 1 Hour (ultimate study guide) | jensenmath.ca
This short clip from JensenMath quickly demonstrates how to find the x- and y-intercepts.
Watch from 28:57 to 31:26. Note how the x-intercept is found by setting the numerator to zero, and the y-intercept is found by setting x to zero.
6. Putting It All Together: A Complete Analysis
Let's synthesise everything we've learned by analysing one function from start to finish.
Function:

Our Step-by-Step Analysis:
-
Factorise:
- Numerator:
- Denominator:
- So,
-
Discontinuities:
- The factor cancels out, so there is a hole at .
- To find the y-coordinate, use the simplified function .
- .
- The hole is at .
- The factor remains in the denominator, so there is a vertical asymptote at .
- The factor cancels out, so there is a hole at .
-
End Behaviour Asymptote:
- The degree of the numerator () is equal to the degree of the denominator ().
- This is Case 2. The horizontal asymptote is the ratio of the leading coefficients: .
- There is a horizontal asymptote at .
-
Intercepts:
- y-intercept: Find .
- .
- The y-intercept is at .
- x-intercept (root): Set the simplified numerator to zero.
- .
- The x-intercept is at .
- y-intercept: Find .
We have now successfully identified every key feature of the function, as summarised in the image.
Conclusion
In this lesson, we have developed a complete toolkit for analysing rational functions. By breaking down the function into its constituent parts, we can systematically uncover all the information needed to understand its behaviour.
Key Takeaways:
- Factorise First: Always start by factoring the numerator and denominator. This reveals the potential discontinuities.
- Discontinuities:
- Vertical Asymptotes come from factors that remain in the denominator after simplification.
- Holes come from factors that are cancelled out from the numerator and denominator.
- End Behaviour Asymptotes: The relationship between the degrees of the numerator () and denominator () determines the end behaviour.
- HA at .
- HA at the ratio of leading coefficients.
- Slant asymptote found by division.
- Intercepts:
- y-intercept: Find .
- x-intercepts (Roots): Find the roots of the simplified numerator.
Preview of the Next Lesson:
We have successfully completed the "analysis" phase. We know how to find the entire "skeleton" of a rational function. In our next lesson, we will put these pieces together to achieve our next learning outcome: Sketch the graph of a rational function using its key features.