Hello!
In our last lesson, we developed a powerful strategy for graphing quadratic functions: instead of plotting many points, we identified key features like the vertex, intercepts, and axis of symmetry. We saw that any quadratic function is just a transformation of the parent function y = x².
Today, we will see how this "key features" approach extends to other types of functions. Our goal is to graph absolute value and basic square root functions and identify their key features. You'll find that the transformation rules we've already learned—translations (shifts), stretches, and reflections—apply in exactly the same way to these new parent functions.
Let's start by looking at the basic shapes of the two functions we'll be studying today.
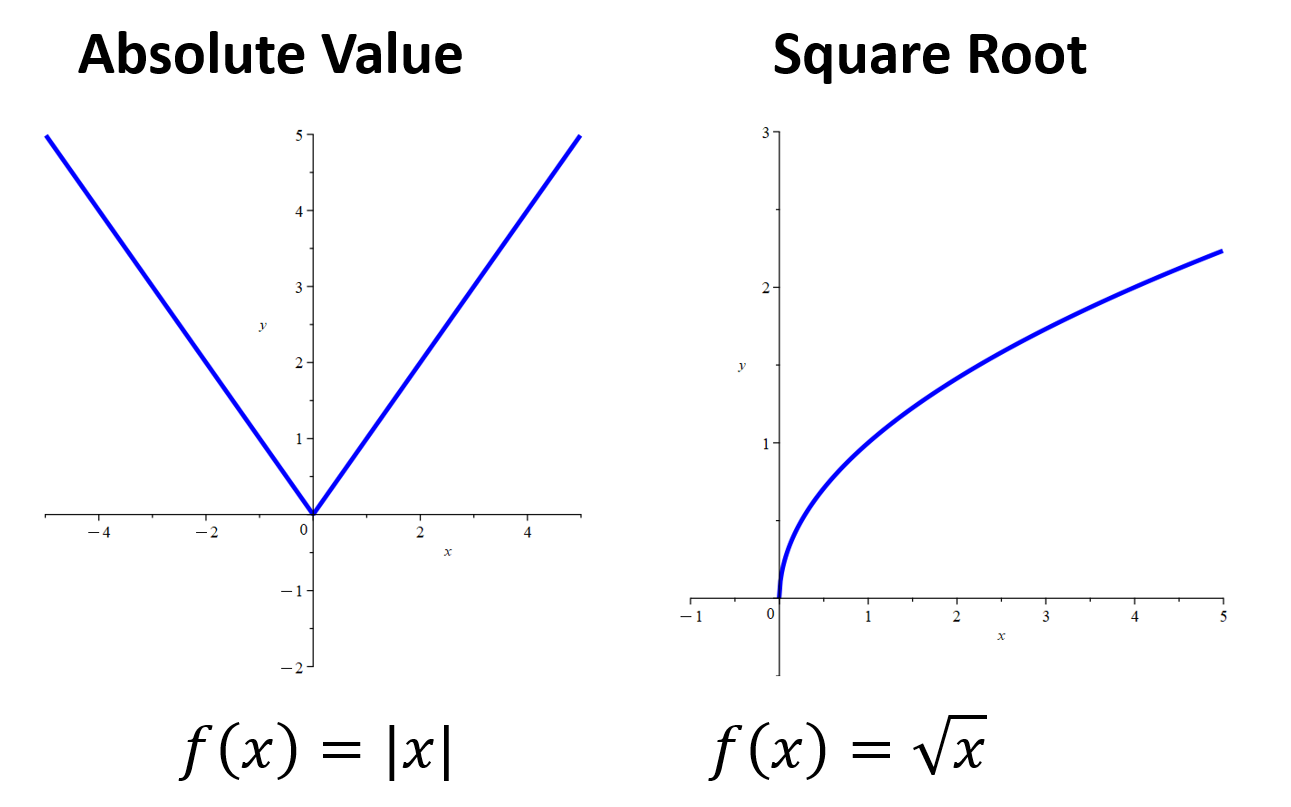
1. Graphing Absolute Value Functions
An absolute value function involves the absolute value of a variable. Remember, the absolute value of a number is its distance from zero on the number line, which is always non-negative. For example, |5| = 5 and |-5| = 5.
Mathematically, the parent absolute value function f(x) = |x| is defined as a piecewise function:
This definition is what creates the characteristic "V" shape.
To understand the parent graph and how we can apply transformations to it, let's watch the first part of a helpful video.
Graphing Absolute Value Functions with Transformations 6 Examples
The video 'Graphing Absolute Value Functions with Transformations' from the ProfRobBob channel provides a great introduction to the parent function and the effect of transformations.
Please watch from 03:20 to 06:43. The presenter explains why the graph of y = |x| has a V-shape and how its key features relate to the simpler linear function y = x.
Transformations of Absolute Value Functions
Just as we transformed y = x² into y = a(x - h)² + k, we can transform the parent function y = |x| into the general form:
The parameters a, h, and k have the same effects you're already familiar with:
- The vertex (the sharp point of the "V") is located at
(h, k). - The parameter
hcontrols the horizontal translation (shift). Remember,x - hshifts the graph right, andx + hshifts it left. - The parameter
kcontrols the vertical translation (shift).+kshifts up, and-kshifts down. - The parameter
acontrols the vertical stretch/compression and reflection.- If
|a| > 1, the graph is stretched vertically (it becomes "narrower"). - If
0 < |a| < 1, the graph is compressed vertically (it becomes "wider"). - If
a < 0, the graph is reflected across the x-axis (the "V" opens downwards).
- If
The following resource provides a concise written summary of these transformations.
Absolute Value Functions: Properties & Graphs
The article 'Absolute Value Functions: Properties & Graphs' from StudySmarter clearly lays out the general form and the role of each parameter.
Please read the sections titled 'Graphing Absolute Value Functions' and 'Absolute Value Function Equation'. Focus on the equation f(x) = a|x - h| + k and the explanation of what a, h, and k do.
Putting It All Together: A Step-by-Step Example
Let's graph f(x) = -2|x - 1| + 4.
-
Find the Vertex
(h, k):- Comparing our function to
a|x - h| + k, we havea = -2,h = 1, andk = 4. - The vertex is at (1, 4).
- Comparing our function to
-
Determine the Shape/Orientation:
- Since
a = -2is negative, the graph opens downwards. - Since
|a| = 2is greater than 1, the graph is vertically stretched by a factor of 2. This means the slopes of the two lines forming the "V" will be+2and-2.
- Since
-
Find the Intercepts:
- y-intercept (set
x = 0):
y = -2|0 - 1| + 4 = -2|-1| + 4 = -2(1) + 4 = 2.
The y-intercept is at (0, 2). - x-intercepts / Roots (set
y = 0):
0 = -2|x - 1| + 4
-4 = -2|x - 1|
2 = |x - 1|
This gives two possibilities:
x - 1 = 2-->x = 3
x - 1 = -2-->x = -1
The x-intercepts are at (3, 0) and (-1, 0).
- y-intercept (set
-
Sketch the Graph: Plot the vertex and intercepts, then draw the downward-opening V-shape.
The video below works through this exact example, visually demonstrating each transformation step by step.
Graphing Absolute Value Functions with Transformations 6 Examples
Let's return to the ProfRobBob video to see a complete example of graphing a transformed absolute value function.
Watch from 17:57 to 22:43. The presenter graphs y = -2|x - 1| + 4, showing how to apply the horizontal shift, reflection, stretch, and vertical shift in sequence.
2. Graphing Basic Square Root Functions
A square root function is one that contains a square root with the independent variable inside the root symbol (the radicand). The parent function is f(x) = √(x).
A crucial feature of the square root function is its domain. Since we cannot take the square root of a negative number in the real number system, the expression inside the square root must be greater than or equal to zero.
- For the parent function
f(x) = √(x), the domain isx ≥ 0. - The range (the set of possible y-values) is also
y ≥ 0.
Let's watch a short introduction to the parent square root function and its key features.
Graphing Radical Functions Using Transformations & Plotting Points
The video 'Graphing Radical Functions' by The Organic Chemistry Tutor provides a quick but clear introduction to the parent square root function.
Watch the first minute (00:00 to 00:59). Pay attention to the shape of the graph, and the specified domain and range.
Transformations of Square Root Functions
The transformation rules we know and love apply here as well. The general form is:
- The point
(h, k)is the starting point of the graph. his the horizontal translation (shift).kis the vertical translation (shift).acontrols the vertical stretch/compression and reflection across the x-axis.
The following resource from a textbook provides an excellent, structured summary of these transformations.
Graphing Square Root Functions 10.1
This PDF document, 'Graphing Square Root Functions', contains a fantastic summary table that lays out all the transformations.
Please read page 546 of the document. Focus on the 'Core Concept' table that summarises Horizontal Translation, Vertical Translation, Reflection, and Stretches/Shrinks. This table is an excellent reference.
Step-by-Step Example with Domain & Range
Let's graph f(x) = \sqrt{x - 1} + 2.

-
Find the Starting Point
(h, k):- Comparing our function to
a√(x - h) + k, we havea = 1,h = 1, andk = 2. - The starting point is at (1, 2).
- Comparing our function to
-
Find the Domain:
- The expression inside the square root must be non-negative.
x - 1 ≥ 0x ≥ 1. So, the domain is[1, ∞). This tells us the graph starts atx=1and extends to the right.
-
Find the Range:
- The starting y-value is
k = 2. Sincea=1is positive, the graph goes upwards from there. - The range is
[2, ∞).
- The starting y-value is
-
Find Intercepts (if any):
- y-intercept (set
x = 0):y = √(0 - 1) + 2. Sincex=0is not in our domain (x ≥ 1), there is no y-intercept. - x-intercept (set
y = 0):0 = √(x - 1) + 2. This gives√(x - 1) = -2. Since the principal square root cannot be negative, there is no x-intercept.
- y-intercept (set
-
Sketch the Graph: Start at the point (1, 2) and draw a curve with the same basic shape as the parent function, moving up and to the right. To get another point for accuracy, you can pick a convenient x-value in the domain, like
x=5:y = √(5 - 1) + 2 = √4 + 2 = 2 + 2 = 4. So the point (5, 4) is on the graph.
The next video segment provides another clear, worked example, tying together the graph, domain, and range.
Graphing Radical Functions Using Transformations & Plotting Points
Let's watch another segment from 'Graphing Radical Functions' to see a full example worked out, including how to find the domain and range from the equation.
Watch from 05:54 to 08:00. This part of the video walks through graphing y = √(x-1) + 2, the same example we just did, and clearly explains how to determine the domain and range.
Test your understanding!
Consider the function g(x) = -\sqrt{x + 4} - 1.
- What is the starting point?
- What is the domain?
- What is the range?
- In which direction will the graph open (up/right, down/right, up/left, down/left)?
Show answer
- The starting point
(h, k)is (-4, -1). - For the domain, we solve
x + 4 ≥ 0, which givesx ≥ -4. So the domain is[-4, ∞). - The starting y-value is -1. The negative sign in front of the square root (
a = -1) means the graph is reflected across the x-axis and will go downwards. The range is(-∞, -1]. - The graph starts at
x=-4and moves to the right (domain), but it opens downwards (reflection). So it will open down and to the right.
Conclusion
Today we've seen how the powerful concept of transformations can be applied to graph new families of functions. By identifying a parent function and its key features—like the vertex of an absolute value function or the starting point of a square root function—we can use our knowledge of shifts, stretches, and reflections to sketch any transformed version.
Key Takeaways:
- The graph of an absolute value function
f(x) = a|x - h| + khas a V-shape with its vertex at(h, k). The parameteradetermines the orientation (up/down) and stretch. - The graph of a square root function
f(x) = a\sqrt{x - h} + kis a curve with a starting point at(h, k). - A critical feature of square root functions is the restricted domain, found by setting the expression inside the square root to be greater than or equal to zero.
- The process of identifying key features (vertex/starting point, intercepts) and using transformations is a versatile strategy for understanding and graphing many types of functions.
Preview of the Next Lesson:
In our next lesson, "Translate word problems into mathematical models using linear and quadratic functions," we will shift our focus to application. You'll learn how to take a real-world scenario, translate it into a linear or quadratic equation, and use the functions we've studied to solve the problem.