Hello!
In our last two lessons, we explored how to transform functions by shifting, stretching, compressing, and reflecting their graphs. We saw that a complex-looking function like y = a * f(b(x - h)) + k is just a transformation of a simpler "parent" function y = f(x).
Today, we'll apply these powerful ideas specifically to quadratic functions. The learning outcome for this lesson is to graph quadratic functions by identifying the vertex, axis of symmetry, and intercepts. We will see that any quadratic function is simply a transformation of the basic parent function y = x². By finding a few key features, we can sketch an accurate graph without the tedious process of plotting dozens of points.
1. The Anatomy of a Parabola
The graph of a quadratic function, y = ax² + bx + c, is a symmetrical U-shaped or n-shaped curve called a parabola. To sketch it accurately, we need to identify its key features.
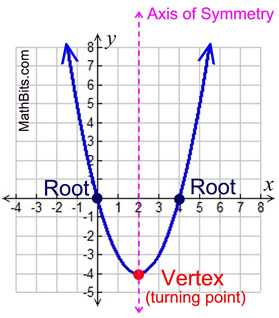
Here are the features we will be finding:
- Shape (or Orientation): Is the parabola U-shaped ("opens up") or n-shaped ("opens down")?
- y-intercept: The point where the graph crosses the vertical y-axis.
- x-intercepts (Roots): The point(s) where the graph crosses the horizontal x-axis. A parabola can have two roots, one root, or no real roots.
- Vertex (or Turning Point): The minimum or maximum point of the parabola.
- Axis of Symmetry: A vertical line that passes through the vertex, dividing the parabola into two mirror-image halves.
Let's begin by watching a video that provides an excellent overview of these features and how to identify them from a graph.
The video 'Quadratic Graphs - GCSE Maths' from 1st Class Maths clearly introduces the key features of a parabola. It uses British terminology and provides clear examples.
Please watch the segment from 06:55 to 09:34. The presenter will show you a graph and walk through identifying the y-intercept, the turning point (vertex), the roots, and the axis of symmetry.
Now, let's learn how to find these features algebraically from the function's equation.
2. Finding the Key Features Algebraically
Let's consider a quadratic function in its general form: y = ax² + bx + c.
Shape (Orientation)
This is the easiest feature to determine. It depends entirely on the sign of the coefficient a (the number in front of x²).
- If
a > 0(positive), the parabola is U-shaped. - If
a < 0(negative), the parabola is n-shaped.
This is because a negative a value corresponds to a reflection in the x-axis, as we saw in our previous lesson.
y-intercept
The y-intercept occurs where x = 0. If we substitute x = 0 into the equation:y = a(0)² + b(0) + c = c
So, the y-intercept is always at the point (0, c).
x-intercepts (Roots)
The x-intercepts occur where y = 0. To find them, you need to solve the quadratic equation ax² + bx + c = 0. You can use any of the methods we've previously covered:
- Factorising (factoring)
- Completing the square
- The quadratic formula
Remember, the value of the discriminant (b² - 4ac) will tell you how many real roots the function has.
3. Finding the Vertex and Axis of Symmetry
Finding the vertex is the most important step in graphing a parabola. We'll explore two highly effective methods.
Method 1: Completing the Square (The Transformation Method)
This method directly connects to our previous lessons on transformations. By completing the square, we can convert the general form y = ax² + bx + c into the vertex form:
When the equation is in this form, you can see it as a series of transformations applied to y = x²:
- A horizontal shift of
hunits. - A vertical stretch by a factor of
a. - A vertical shift of
kunits.
The result is that the vertex of the parabola is located at the point (h, k). The axis of symmetry is the vertical line x = h.
The following video masterfully demonstrates this process.
■ How to sketch quadratic graphs by completing the square + examples!
The video 'How to sketch quadratic graphs by completing the square' from maths unboxed will walk you through converting a quadratic to vertex form to find its turning point (vertex).
Watch from 03:11 to 06:22. The presenter provides a clear, step-by-step guide to completing the square and then immediately reading the coordinates of the vertex from the resulting equation. Pay close attention to the signs.
Method 2: Using a Formula (The Direct Method)
A more direct way to find the vertex is by using a formula for its x-coordinate. For any quadratic y = ax² + bx + c, the x-coordinate of the vertex is given by:
This formula is incredibly useful. It directly gives you the equation for the axis of symmetry, x = -b / (2a).
To find the y-coordinate of the vertex, you simply substitute this x-value back into the original quadratic equation.
The resource below explains this formula. It uses American terminology, where "general form" is ax²+bx+c and "standard form" is the vertex form we saw above.
The article 'Graphs of Quadratic Functions' from Math LibreTexts provides a formal definition of the vertex formula. This is a very efficient alternative to completing thesquare.
First, read the subsection titled 'Forms of a Quadratic Function'. Note the definitions of 'general form' and 'standard form' (vertex form). Then, read the subsection 'Vertex and Axis of Symmetry', focusing on 'Example 3a', which demonstrates how to use the formula x = -b/(2a).
A fascinating insight is that the x-coordinate of the vertex is always exactly halfway between the two roots. The formula x = -b / (2a) is simply a way of finding the midpoint of the roots as given by the quadratic formula.
Test your understanding!
Find the vertex of the quadratic function y = 2x² - 8x + 5 using the formula x = -b / (2a).
Show answer
Here, a = 2 and b = -8.
-
Find the x-coordinate:
x = -(-8) / (2 * 2) = 8 / 4 = 2.
The axis of symmetry isx = 2. -
Find the y-coordinate by substituting
x = 2back into the equation:y = 2(2)² - 8(2) + 5 = 2(4) - 16 + 5 = 8 - 16 + 5 = -3.
The vertex is at (2, -3).
4. Putting It All Together: Sketching the Graph
We now have all the tools we need. Here is a step-by-step guide to sketching a quadratic graph.
Let's use the example y = x² + 2x - 3.
-
Shape: The coefficient of
x²isa = 1, which is positive. So, the graph is U-shaped. -
y-intercept: The constant term is
c = -3. So, the y-intercept is at (0, -3). -
Vertex: Let's use the formula
x = -b / (2a). Herea = 1,b = 2.- x-coordinate:
x = -2 / (2 * 1) = -1. - y-coordinate:
y = (-1)² + 2(-1) - 3 = 1 - 2 - 3 = -4. - The vertex is at (-1, -4).
- x-coordinate:
-
Axis of Symmetry: This is the vertical line through the vertex. Its equation is
x = -1. -
x-intercepts (Roots): Set
y = 0and solvex² + 2x - 3 = 0.- We can factorise this:
(x + 3)(x - 1) = 0. - The roots are at x = -3 and x = 1. The coordinates are (-3, 0) and (1, 0).
- We can factorise this:
-
Sketch: Plot the key points you've found:
- Vertex:
(-1, -4) - Intercepts:
(0, -3),(-3, 0),(1, 0) - Draw a smooth, symmetrical U-shaped curve passing through these points. You can also use the axis of symmetry to find a "bonus" point. Since
(0, -3)is 1 unit to the right of the axisx = -1, there must be a symmetric point 1 unit to the left, at(-2, -3).
- Vertex:
The webpage from Third Space Learning provides another excellent worked example.
Quadratic Graphs - GCSE Maths - Steps, Examples & ...
The article 'Quadratic Graphs' provides a concise, step-by-step example of this entire process.
Find the section titled '3. Sketching quadratic graphs' and read through 'Example 3: Sketching a trinomial quadratic'. This example follows the exact steps we just outlined.
Conclusion
You now know how to deconstruct and graph any quadratic function by focusing on its essential characteristics. This "key features" approach is far more insightful than just plotting points, as it reveals the underlying structure of the function, which is directly linked to the transformations we've been studying.
Key Takeaways:
- A parabola's graph is defined by its shape (orientation), vertex, axis of symmetry, and intercepts.
- The sign of the
aterm iny = ax² + bx + cdetermines if the parabola is U-shaped (a>0) or n-shaped (a<0). - The y-intercept is
(0, c), and the x-intercepts (roots) are found by solvingax² + bx + c = 0. - The vertex can be found in two main ways:
- Completing the square to get vertex form
y = a(x - h)² + k, where the vertex is(h, k). - Using the formula
x = -b / (2a)to find the x-coordinate, then substituting to find the y-coordinate.
- Completing the square to get vertex form
- The axis of symmetry is the vertical line
x = hthat passes through the vertex.
Preview of the Next Lesson:
We will continue to practice this method of analysing and graphing functions based on their key features. In the next lesson, we will apply these skills to two new function families: absolute value functions and basic square root functions. You'll see that the same fundamental principles of identifying key points and understanding transformations apply there as well.