Welcome to the next lesson in our Machine Learning module. In our previous session, we saw how to use k-fold cross-validation to get a robust estimate of model performance. The cross_val_score function returned an array of scores, which we summarized with a mean and standard deviation. But what does a score of "0.96" actually mean? Is it good? Does it tell the whole story?
This lesson answers those questions. Your goal is to learn how to select appropriate evaluation metrics for regression (MAE, RMSE) and classification (Precision, Recall, F1, ROC-AUC) tasks. Choosing the right metric is one of the most critical decisions in a machine learning project. It defines your target, guides your model tuning, and ultimately determines whether the model you build is truly useful for solving the business problem at hand.
1. Classification Metrics: Is the Model Correct?
Let's start with classification, where the goal is to predict a discrete category (e.g., spam or not spam, cat or dog). While we might be tempted to just ask "how many predictions were correct?", we'll soon see that this is often not enough.
The Confusion Matrix: A Deeper Look at Errors
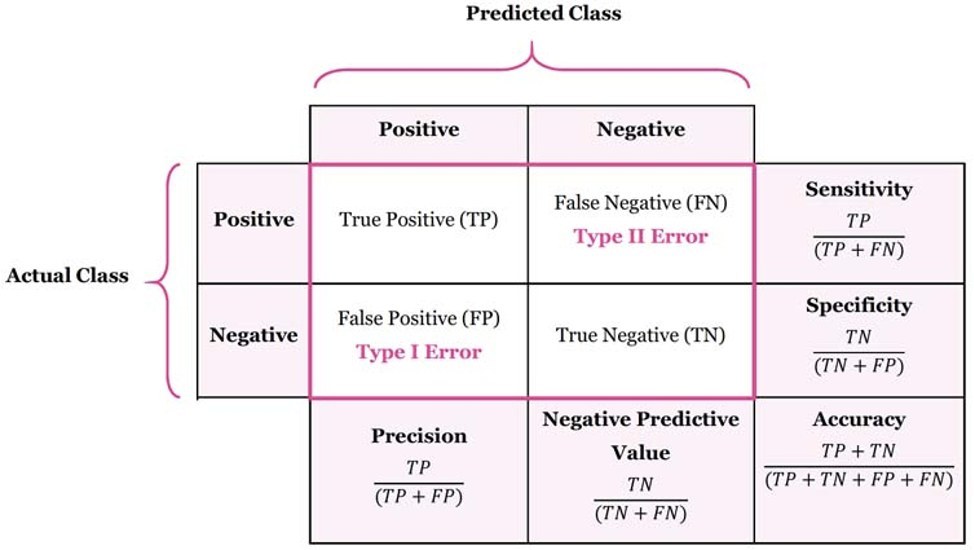
Nearly all classification metrics are derived from the confusion matrix. This simple table is the foundation for understanding your model's performance because it shows you not just if your model was wrong, but how it was wrong.
A confusion matrix breaks down predictions into four categories:
- True Positives (TP): The model correctly predicted the positive class. (e.g., correctly identified a spam email as spam).
- True Negatives (TN): The model correctly predicted the negative class. (e.g., correctly identified a normal email as not spam).
- False Positives (FP): The model incorrectly predicted the positive class. (e.g., a normal email was flagged as spam). This is also known as a Type I error.
- False Negatives (FN): The model incorrectly predicted the negative class. (e.g., a spam email was missed and ended up in your inbox). This is also known as a Type II error.
Accuracy: The Simple, but Deceptive, Metric
The most intuitive metric is accuracy: the proportion of total correct predictions.
While simple, accuracy can be dangerously misleading, especially with imbalanced datasets.
Imagine a model for detecting a rare disease that occurs in 1% of the population. A lazy model that always predicts "no disease" would have 99% accuracy! It seems great, but it's completely useless because it fails to identify any of the sick patients (the positive class) we care about.
For a more detailed explanation, read the following article which explains the pitfalls of relying solely on accuracy.
Model Evaluation Metrics: Accuracy, Precision, Recall, F1 Score ...
This section from ML4Devs.com clearly explains why accuracy is not always the best metric.
Read the section "Accuracy: Simple But Often Misleading". Focus on understanding when accuracy is useful (balanced classes, similar error costs) and when it fails (imbalanced datasets).
Because accuracy can be misleading, we need metrics that tell us more about the types of errors our model is making. This leads us to the crucial trade-off between Precision and Recall.
Precision and Recall: The Fundamental Trade-Off
Precision and Recall are two of the most important metrics in classification. They focus on the performance of the positive class and help us understand the balance between different kinds of errors.
-
Precision: Answers the question, "Of all the instances the model predicted as positive, how many were actually positive?"
High precision is critical when the cost of a False Positive is high. For example, in a spam filter, a false positive means an important email lands in your spam folder. You want to be very precise when you declare an email as spam.
-
Recall (also known as Sensitivity or True Positive Rate): Answers the question, "Of all the actual positive instances, how many did the model successfully capture?"
High recall is critical when the cost of a False Negative is high. In medical diagnostics, a false negative means a sick patient is told they are healthy. You want to recall or capture as many positive cases as possible.
This video from AssemblyAI offers a great intuitive explanation of the difference between these two concepts.
How to evaluate ML models | Evaluation metrics for machine learning
The video "How to evaluate ML models" gives a clear, concise overview of precision and recall.
Watch the segment from precision and recall. The speaker does an excellent job of phrasing what each metric tells you about your model's performance.
There is almost always a trade-off between precision and recall. Increasing one often decreases the other. The "right" balance depends entirely on your business problem.
F1-Score: A Balanced Measure
What if you need a balance of both precision and recall? The F1-Score is the harmonic mean of the two.
The F1-score provides a single number that balances both concerns. It's particularly useful for imbalanced datasets where you care about both minimizing false alarms (high precision) and not missing positive cases (high recall). Because it's a harmonic mean, it heavily penalizes models where either precision or recall is very low.
ROC Curve and AUC
Many classifiers don't just output a hard label (0 or 1) but rather a probability score. We then use a threshold (e.g., 0.5) to convert that probability into a classification.
The Receiver Operating Characteristic (ROC) curve is a plot that shows the performance of a classification model at all possible classification thresholds. It plots the True Positive Rate (Recall) against the False Positive Rate.
The Area Under the ROC Curve (ROC-AUC) summarizes this plot into a single number.
- AUC = 1.0: A perfect classifier.
- AUC = 0.5: A useless classifier, equivalent to random guessing.
- AUC > 0.5: The model has some skill in separating classes.
ROC-AUC is a very popular metric because it evaluates the model's ability to discriminate between classes, independent of the chosen threshold. This makes it great for comparing different models.
For a great summary of all these classification metrics, please review this guide.
Mastering Machine Learning Metrics: The Complete Guide to ...
This Medium article by Soumyadeep Saha provides a comprehensive guide to classification metrics, complete with clear definitions and examples.
Read the entire section on "Classification Metrics". For each metric (Accuracy, Precision, Recall, F1-Score, ROC-AUC), pay attention to the "When to use" and "Conclusion" boxes, as they provide excellent summaries for practical application.
2. Regression Metrics: How Wrong Is the Model?
For regression tasks, where we predict a continuous value (like a house price), the concept of "correct" or "incorrect" doesn't apply. Instead, we measure the magnitude of the error—how far off our predictions are from the actual values.
Mean Absolute Error (MAE)
Mean Absolute Error (MAE) is the average of the absolute differences between the predicted and actual values.
- Interpretation: "On average, our model's predictions are off by [MAE value]."
- Key Property: It's easy to interpret because it's in the same units as the target variable. It's also less sensitive to outliers than RMSE.
Mean Squared Error (MSE) & Root Mean Squared Error (RMSE)
Mean Squared Error (MSE) is the average of the squared differences between predicted and actual values.
Root Mean Squared Error (RMSE) is the square root of the MSE.
- Interpretation: Like MAE, RMSE is in the same units as the target variable.
- Key Property: By squaring the errors, RMSE penalizes large errors much more than MAE does. If your model has a few very bad predictions, your RMSE will be significantly higher than your MAE. This makes it a good metric to use when large errors are particularly undesirable.
The following video provides an excellent deep dive into these regression metrics, explaining their nuances and when to choose one over the other.
Evaluation Metrics For Regression - When & Why To Use What
This NeuralNine video, "Evaluation Metrics For Regression," offers a practical guide to choosing and interpreting regression metrics.
Focus on these two segments: MSE and RMSE: This part clearly explains the formulas and highlights the difference in their use cases (MSE for optimization, RMSE for human interpretation). MAE: This segment explains MAE's robustness to outliers and its straightforward interpretation.
The image below shows how these metrics might appear in a real project report, giving you a sense of how you'll use them to analyze model performance.

3. How to Choose the Right Metric
Now, let's synthesize this knowledge. The choice of metric is not just a technical detail; it's a business decision. Here are some guiding questions to help you select the right metric for your task.
For a CLASSIFICATION task:
- Are the classes balanced?
- Yes:
accuracyis a reasonable starting point. - No: Avoid
accuracy. Focus on metrics that handle imbalance well, likef1,precision,recall, orroc_auc.
- Yes:
- What is the cost of a False Positive vs. a False Negative?
- High cost for False Positives? (e.g., marking an important email as spam) -> Optimize for Precision.
- High cost for False Negatives? (e.g., failing to detect fraud) -> Optimize for Recall.
- Need a balance? -> Use the F1-Score.
- Do you need to compare models across different decision thresholds? -> Use ROC-AUC.
For a REGRESSION task:
- Are there outliers that you don't want to dominate the metric? -> Use MAE, as it is more robust.
- Are large errors especially bad and need to be heavily penalized? -> Use RMSE.
- Which is easier to explain to stakeholders? -> Both MAE and RMSE are interpretable as they are in the original units, but MAE's "average absolute error" is often the most straightforward to communicate.
Using Metrics in Scikit-Learn
In our previous lesson, we used cross_val_score. You can easily specify which metric to use with the scoring parameter. Scikit-learn has a wide range of predefined scoring strings.
from sklearn.model_selection import cross_val_score
from sklearn.linear_model import LogisticRegression
from sklearn.datasets import make_classification

X, y = make_classification(n_samples=1000, n_features=20, n_informative=2,
                           n_redundant=10, random_state=42, n_classes=2, flip_y=0.1)

model = LogisticRegression(max_iter=1000)


# Evaluate using different metrics
f1_scores = cross_val_score(model, X, y, cv=5, scoring='f1')
roc_auc_scores = cross_val_score(model, X, y, cv=5, scoring='roc_auc')

print(f"Average F1 Score: {f1_scores.mean():.3f} (+/- {f1_scores.std():.3f})")
print(f"Average ROC-AUC: {roc_auc_scores.mean():.3f} (+/- {roc_auc_scores.std():.3f})")


# For regression, you would use scoring='neg_mean_absolute_error' or 'neg_mean_squared_error'
# The score is negative because scikit-learn's convention is to maximize scores,
# so it maximizes the negative error (which is the same as minimizing the error).
Conclusion
You now have a solid framework for evaluating machine learning models. You've learned that the "best" metric is entirely dependent on the context of your problem.
Key Takeaways:
- Classification:
- Start with the confusion matrix to understand error types.
- Use Accuracy only for balanced datasets with symmetric error costs.
- Use Precision when false positives are costly.
- Use Recall when false negatives are costly.
- Use F1-Score for a balance between Precision and Recall, especially with imbalanced data.
- Use ROC-AUC to evaluate a model's overall ability to discriminate between classes, independent of a specific threshold.
- Regression:
- Use MAE for a robust, interpretable measure of average error.
- Use RMSE to penalize large errors more heavily.
In our next module, we will dive into Feature Engineering. Now that you know how to measure performance, you'll be able to use these metrics to test whether the new features you create are actually improving your models.