Welcome to the first lesson in our module on Data Visualization and Exploratory Data Analysis (EDA). In the previous module, we honed your skills in wrangling and cleaning data with Pandas. You learned how to correct data types and standardize messy strings, transforming raw data into a reliable format. That was the essential groundwork; now, we get to the rewarding part: making that data speak.
This lesson kicks off your journey into data visualization by focusing on matplotlib, the foundational plotting library in Python. We'll cover how to create the three most fundamental plots for data analysis: line plots, scatter plots, and bar charts. More importantly, we'll go beyond just generating a plot and learn how to customize it for clarity and presentation—a crucial skill for creating impressive portfolio projects.
1. The Anatomy of a Matplotlib Plot
Before we start plotting, it's helpful to understand the main components of a matplotlib visualization. Just as in software development where you might choose between a simple script and an object-oriented design, matplotlib offers two primary ways to create plots:
- A simple, state-based interface using
pyplot(often imported asplt). - A more powerful and flexible object-oriented (OO) interface.
For creating clear, customizable plots suitable for data science projects, the object-oriented approach is generally preferred. It gives you explicit control over every element of your visualization.
The core of the OO interface revolves around two objects: the Figure and the Axes.
Let's clarify this terminology.
Beginner's Guide To Matplotlib (With Code Examples)
This guide from Zero To Mastery provides an excellent explanation of the two plotting methods and the key terminology.
Focus on the section "Two ways of creating plots" and "Anatomy of a Matplotlib Figure". Pay close attention to the definitions of Figure, Axes, and Axis. Understanding the difference between the simple plt.plot() approach and the fig, ax = plt.subplots() object-oriented approach is key to creating complex and custom visualizations later.
The standard workflow for creating a plot using the object-oriented API looks like this:
- Import
matplotlib.pyplot as plt. - Prepare your data (usually in a Pandas DataFrame).
- Setup the plot by creating a
Figureand one or moreAxeswithfig, ax = plt.subplots(). - Plot the data on the desired
Axesobject (e.g.,ax.scatter(...)). - Customize the plot by setting titles, labels, colors, etc. (e.g.,
ax.set_title(...)). - Show or save the plot (
plt.show()orfig.savefig()).
This structured approach is highly reproducible and is the one we'll use throughout the course.
2. Creating Fundamental Plots: Line, Scatter, and Bar
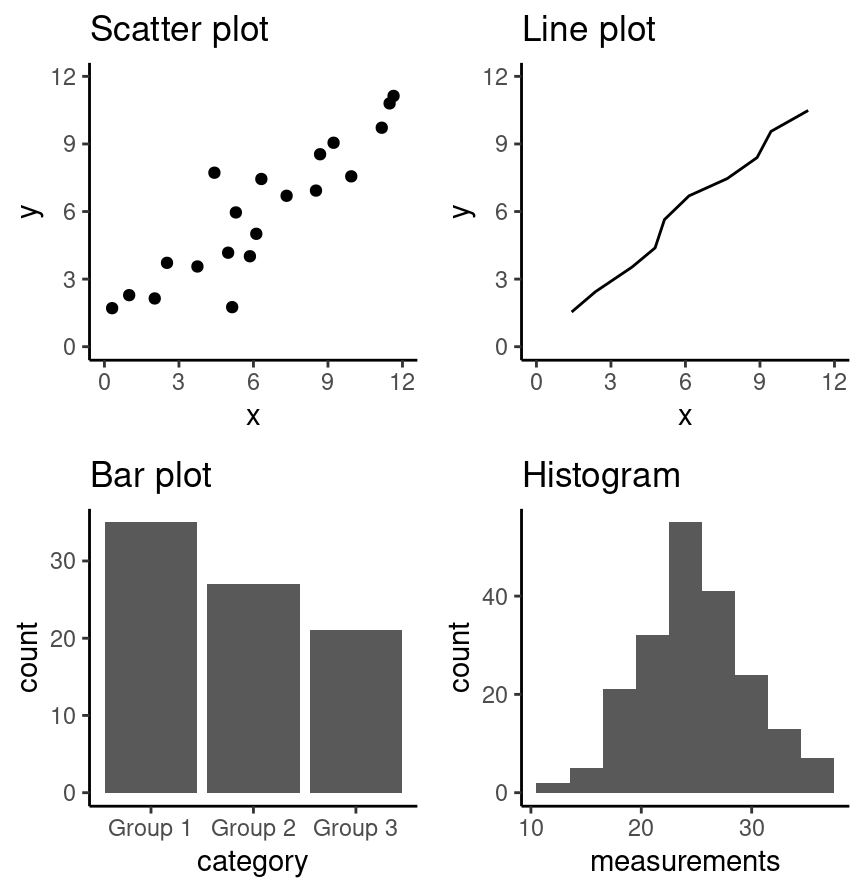
With the basic structure in mind, let's look at how to create the three most common plot types. Each one serves a distinct purpose:
- Line Plot: Best for visualizing a trend in data over a continuous interval or time.
- Scatter Plot: Ideal for investigating the relationship between two numerical variables.
- Bar Chart: Used to compare quantities across different categories.
The following video offers a quick and practical demonstration of how to create each of these plots.
Learn Matplotlib in 30 Minutes - Python Matplotlib Tutorial
This video, "Learn Matplotlib in 30 Minutes" by Tech With Tim, provides a fast-paced overview of the library's capabilities.
We'll watch a few separate segments to cover the basics of each plot type: First, watch the introduction to a basic line plot. Next, watch how to create a more detailed line plot with size, labels, and a grid. Then, skip ahead to see how to build a scatter plot. Finally, watch the section on creating a bar chart. Focus on the primary function used for each plot: ax.plot(), ax.scatter(), and ax.bar().
3. Plotting Directly from Pandas DataFrames
While it's good to know how to plot from simple lists or NumPy arrays, as a data scientist, you will almost always be plotting data held in a Pandas DataFrame. Fortunately, Pandas is built on matplotlib and has a convenient .plot() method that simplifies this process.
This allows you to quickly generate plots for initial exploratory analysis without needing to extract columns into separate variables first.
Learn Data Visualization with Matplotlib in Python: A Beginner’s Guide
The video "Learn Data Visualization with Matplotlib" by Code with Josh demonstrates this practical, data-centric approach using an Airbnb dataset.
Watch the section from Pandas plotting. Note how you can call .plot() directly on a DataFrame or Series. Pay attention to the kind parameter (e.g., kind='scatter') and how you can specify columns for the x and y axes.
This DataFrame-centric plotting is a powerful shortcut for EDA, but for final, presentation-quality plots, you'll want more control. This is where we combine the two approaches: use plt.subplots() to create your canvas (fig, ax) and then pass DataFrame columns to the ax plotting methods (e.g., ax.scatter(x=df['col1'], y=df['col2'])).
4. Customizing Your Plots for Presentation
Creating a plot is easy. Creating a plot that is clear, informative, and professional takes deliberate effort. For your portfolio projects, the quality of your visualizations matters just as much as the quality of your analysis. Customization is how you guide your audience's attention and tell a compelling story with your data.
Key customizations include:
- Setting clear titles and axis labels with units.
- Using color, line styles, and markers to distinguish data.
- Adding a legend to explain what each visual element represents.
- Adjusting plot dimensions and removing unnecessary clutter (like extraneous borders).
- Saving the final figure in a high-resolution format.
The following article provides a fantastic step-by-step walkthrough of transforming a "decent" default plot into a "great" one, focusing on the principles of clear communication.
Making pretty plots in Python: customizing plots in matplotlib
This article from Practical Data Science is a masterclass in thoughtful plot design. It walks through a series of refinements to a basic line plot.
Read through all the numbered steps (1-6). For each step, focus on the why behind the change, not just the code. 1 & 2: How color and line style can be used to distinguish and emphasize information. 3: The concept of improving the "data-to-ink ratio" by removing chart junk. 4: A clever trick to make legends easier to read by placing labels directly on the plot. 5 & 6: The importance of legible fonts and saving your plot with an appropriate resolution (dpi) for professional use.
Finally, let's see how to save your masterpiece. After you've customized your plot, you can save it to a file using fig.savefig().
Learn Matplotlib in 30 Minutes - Python Matplotlib Tutorial
Let's return one last time to the "Learn Matplotlib in 30 Minutes" video.
Watch the short segment on saving figures. The key takeaway is the savefig() function, which allows you to save your Figure object to formats like PNG, PDF, or SVG for use in reports and presentations.
Conclusion
In this lesson, you've taken your first steps into the world of data visualization with Matplotlib. You've learned the fundamental components of a plot and how to create and customize the essential chart types used in data science.
Key Takeaways:
- The Object-Oriented API (
fig, ax = plt.subplots()) provides the most flexibility and control for creating high-quality plots. - Line plots (
ax.plot), scatter plots (ax.scatter), and bar charts (ax.bar) are the foundational tools for visualizing trends, relationships, and comparisons. - You can rapidly generate plots for exploration directly from Pandas DataFrames using the
.plot(kind=...)method. - Customization is communication. Thoughtful use of titles, labels, colors, and layout transforms a basic chart into a professional and insightful visualization.
- Always save your final plots with
fig.savefig()at a high resolution to ensure they look sharp in your portfolio.
We've focused on matplotlib because it's the engine behind most plotting in Python. In our next lesson, we will build on this foundation by introducing Seaborn, a library that makes it even easier to create sophisticated and aesthetically pleasing statistical visualizations like histograms, box plots, and heatmaps.