Welcome back! In our previous lessons, you've accomplished a great deal: from training and evaluating a machine learning model to explaining its predictions with SHAP and containerizing a serving API with Docker. You now have all the components of a complete end-to-end machine learning project.
This lesson focuses on the final and arguably most crucial step for your portfolio: documenting your work. We will consolidate your entire workflow—from data exploration to model deployment—into a single, comprehensive Jupyter Notebook. A well-crafted notebook is more than just a script; it's a narrative that showcases your technical skills, analytical thinking, and ability to communicate complex findings, all of which are vital for impressing potential employers.
By the end of this lesson, you will be able to write a polished, professional Jupyter Notebook that clearly documents your project and justifies your key decisions, making it the centerpiece of your portfolio.
1. What is a Jupyter Notebook? A Quick Refresher
While you've likely used Jupyter Notebooks in your coursework, let's quickly solidify the core concepts that make them perfect for data science storytelling. A notebook is an interactive environment that allows you to combine live code, explanatory text (using Markdown), and visualizations in one document.
This video provides an excellent overview of the Jupyter environment and its core features.
Jupyter Notebook Complete Beginner Guide - From Jupyter to Jupyterlab, Google Colab and Kaggle!
This video, "Jupyter Notebook Complete Beginner Guide," by Rob Mulla, is a great introduction to the power and flexibility of Jupyter Notebooks.
Please watch the first two sections to understand the fundamental concepts: Introduction to Jupyter: This part explains what notebooks are and how they improve on standard Python scripts for interactive data work. Code and Markdown Cells: Pay close attention to the distinction between code cells (for running Python) and markdown cells (for writing formatted text). This is the key to building a narrative around your analysis.
2. Structuring Your Notebook as a Story
A great project notebook doesn't just present code; it tells a compelling story. It guides the reader through the problem, your methodology, your findings, and the final impact. An effective way to structure this story is to think like you're presenting your project to a stakeholder.
The following video introduces a simple yet powerful four-step framework for presenting data science projects. We will adapt this framework to structure your notebook.
How To Effectively Present Your Data Science Projects | Data Storytelling
In "How To Effectively Present Your Data Science Projects," data scientist Madhav Thaker outlines a framework for data storytelling. While he discusses slide decks, the principles apply perfectly to a Jupyter Notebook.
Watch these key sections to understand the framework: The 4-Step Framework: Note the four parts: Problem Statement, Performance Metrics, Technical Details, and Next Steps. Problem & Solution: This explains how to frame the problem and its business impact. Model Results: Learn how to present performance metrics clearly and concisely. Technical Details: This covers how to explain your approach without overwhelming the reader. Next Steps: This is about concluding with actionable insights and future work.
Based on this framework, your notebook should follow a logical flow:
- Problem: What are you trying to solve and why is it important?
- Results: A high-level summary of your final model's performance.
- Process: The detailed, step-by-step walkthrough of your work (EDA, preprocessing, modeling, etc.).
- Conclusion: A summary of your findings and a discussion of next steps.
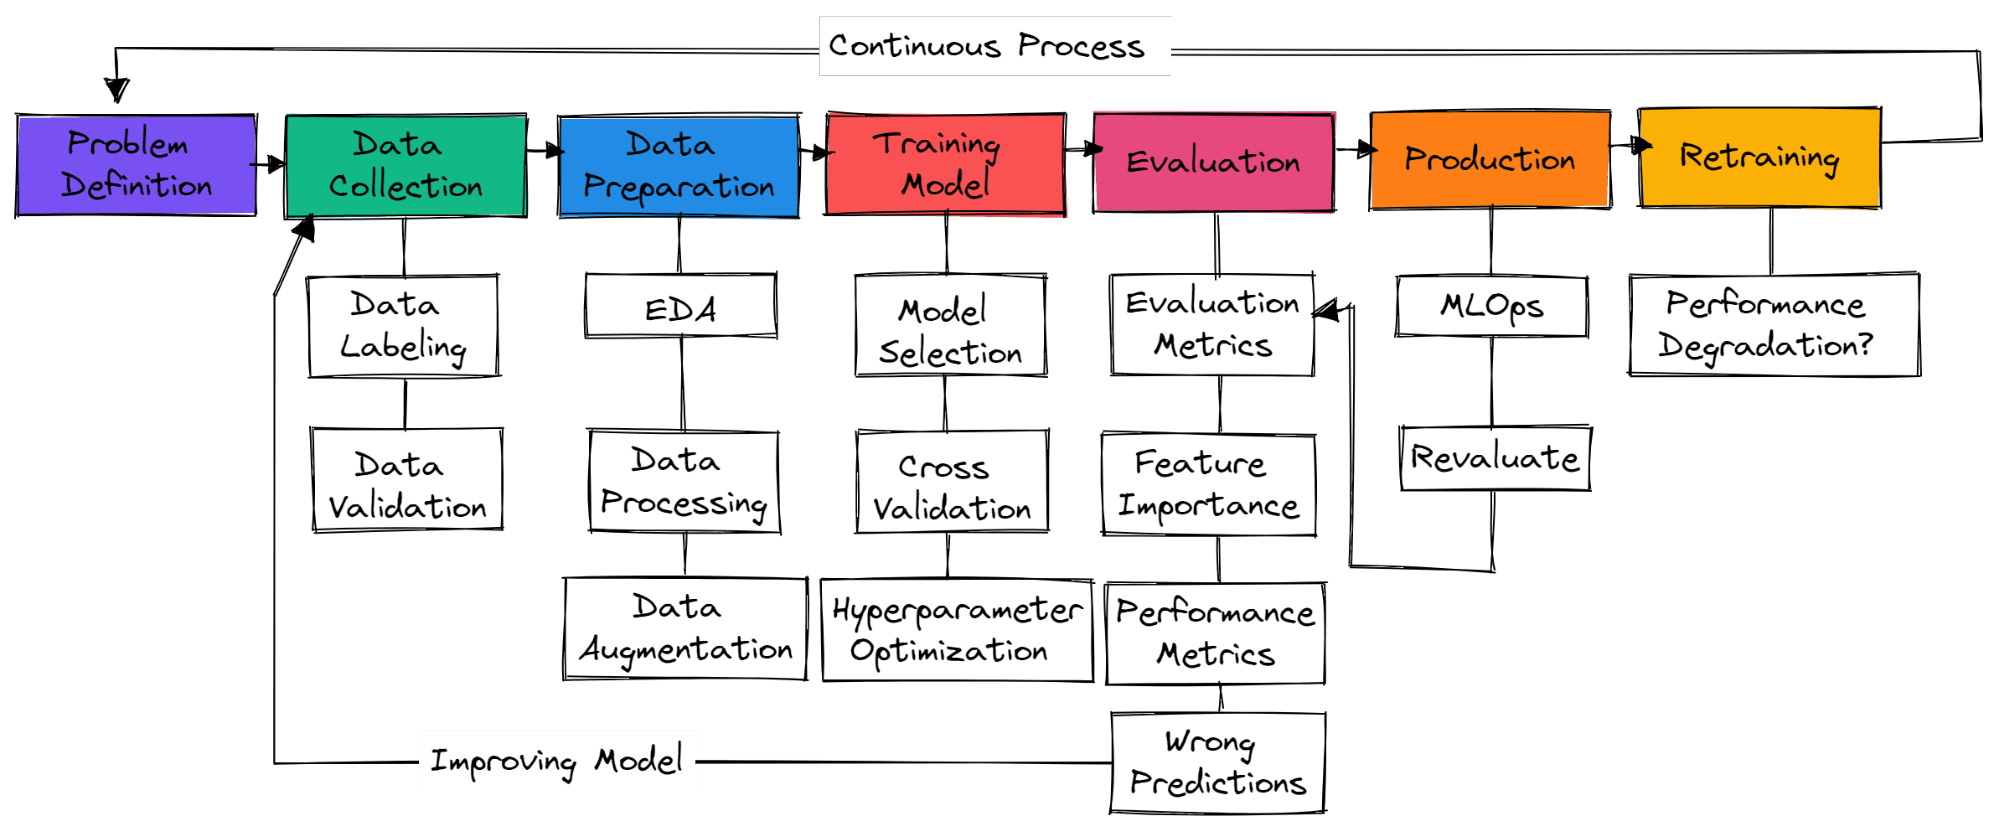
This flowchart shows the iterative process of a machine learning project. Your notebook should document each of these stages, from problem definition to evaluation.
3. Best Practices for a Professional Notebook
A well-structured narrative needs to be supported by clean, reproducible, and well-documented code. Let's cover the best practices that elevate a notebook from a personal script to a professional document.
Mastering Jupyter Notebooks: Best Practices for Data Science
This article from CoderPad provides excellent, actionable advice for creating high-quality notebooks.
Focus on these three sections: "Ensure your Notebook stays focused": Read the subsection on "Best practices for keeping your Notebooks well organized." This reinforces the need for a clear objective and structure. "Mastering Markdown usage": This section details how to use Markdown to create headers, lists, and descriptive text that builds the narrative and explains your visualizations. "Cell execution order discipline": This is critical. It explains the importance of ensuring your notebook runs linearly from top to bottom. The "Restart and Run All" feature is your best friend for verifying reproducibility.
4. Your Project Notebook: A Complete Template
Now, let's combine these principles into a concrete template for your end-to-end project. This structure ensures you cover all necessary points and justify your decisions, which is exactly what recruiters and hiring managers look for.
The project guide from a university ML course, CIS 520 Final Project, provides an excellent reference for the level of detail expected in a high-quality project report. We'll use its structure as a guide.
CIS 520, Machine Learning, Fall 2019 Final Project
This document outlines the requirements for a final project in a machine learning course. Its structure is a great model for a professional portfolio piece.
Review the "Report Sections" part of the document. Notice how it requires justification for every major decision, from problem formulation to the choice of methods and evaluation metrics. We will integrate this level of justification into our notebook template.
Here is a comprehensive template for your project notebook. Use Markdown cells (#, ##, *, etc.) to create the headings and explanatory text.
Project Notebook Template
1. Project Title & Introduction
- Objective: Start with a clear, concise statement of the problem you are solving (e.g., "Predicting customer churn to reduce revenue loss").
- Dataset: Briefly describe the dataset, its source, and why it's suitable for this problem.
- Approach: Give a high-level overview of your plan (e.g., "This notebook documents the process of exploring the data, building several classification models, and evaluating their performance to select the best one for deployment.").
2. Data Exploration and Cleaning (EDA)
- Import Libraries & Load Data: Your first code cell.
- Initial Inspection: Use
.info(),.describe(), and.head()to get a first look. - Data Cleaning: Document how you handled missing values or duplicates and justify your choices (e.g., "Missing values in the 'Age' column were filled with the median, as the distribution was skewed.").
- Visualization: Create plots (histograms, bar charts, scatter plots) to understand distributions and relationships. Every plot must have a title, labeled axes, and a Markdown cell explaining what the plot shows and what insights you drew from it.
3. Feature Engineering & Preprocessing
- Feature Creation: If you created new features, explain what they represent and why you thought they would be useful.
- Encoding & Scaling: Explain your strategy for categorical and numerical features. Justify your methods (e.g., "One-hot encoding was used for the 'Region' feature to avoid imposing an ordinal relationship. Numerical features were scaled using StandardScaler because many algorithms, like logistic regression, perform better with standardized data.").
- Train-Test Split: Perform the split and explain its purpose.
4. Modeling
- Baseline Model: Start with a simple model (e.g., Logistic Regression). Explain why you chose it as a baseline.
- Advanced Models: Introduce the other models you tested (e.g., Random Forest, XGBoost). Briefly explain why you chose them (e.g., "Random Forest was chosen for its robustness and ability to handle interactions between features.").
- Training & Cross-Validation: Show the code for training your models. If you used cross-validation, explain why it provides a more robust performance estimate.
5. Evaluation
- Metrics Selection: State the metrics you used (e.g., Accuracy, Precision, Recall, F1-Score, ROC-AUC) and justify why they are appropriate for your problem (e.g., "For this imbalanced churn dataset, F1-Score and ROC-AUC are more informative than accuracy, as they provide a better measure of performance on the minority class.").
- Results: Present the performance of all models in a clean table (a Pandas DataFrame is great for this).
- Interpretation: Analyze the results. Which model performed best? Why do you think that is? Select your champion model.
6. Model Explainability
- Feature Importance/SHAP: Include the plots from your SHAP analysis (e.g., summary plot, dependence plots).
- Interpretation: In a Markdown cell, interpret the plots. What are the most important features driving the model's predictions? What is their relationship with the outcome? This demonstrates a deep understanding of your model's behavior.
7. Conclusion & Next Steps
- Summary of Findings: Briefly summarize the project and your final model's performance.
- Business Impact: Connect your results back to the original problem. How could your model be used? (e.g., "The final XGBoost model can identify customers at high risk of churning with 85% precision, allowing the marketing team to target them with retention offers.").
- Next Steps: Mention the work you did to deploy the model. This is a perfect place to link to your project's GitHub repository and mention the containerized FastAPI you built.
5. Your Task: Write Your Project Notebook
Your final task for this lesson is to create this comprehensive notebook for your project.
- Create a new notebook in your project directory (e.g.,
ml_project_notebook.ipynb). Your project directory should have a clean structure.
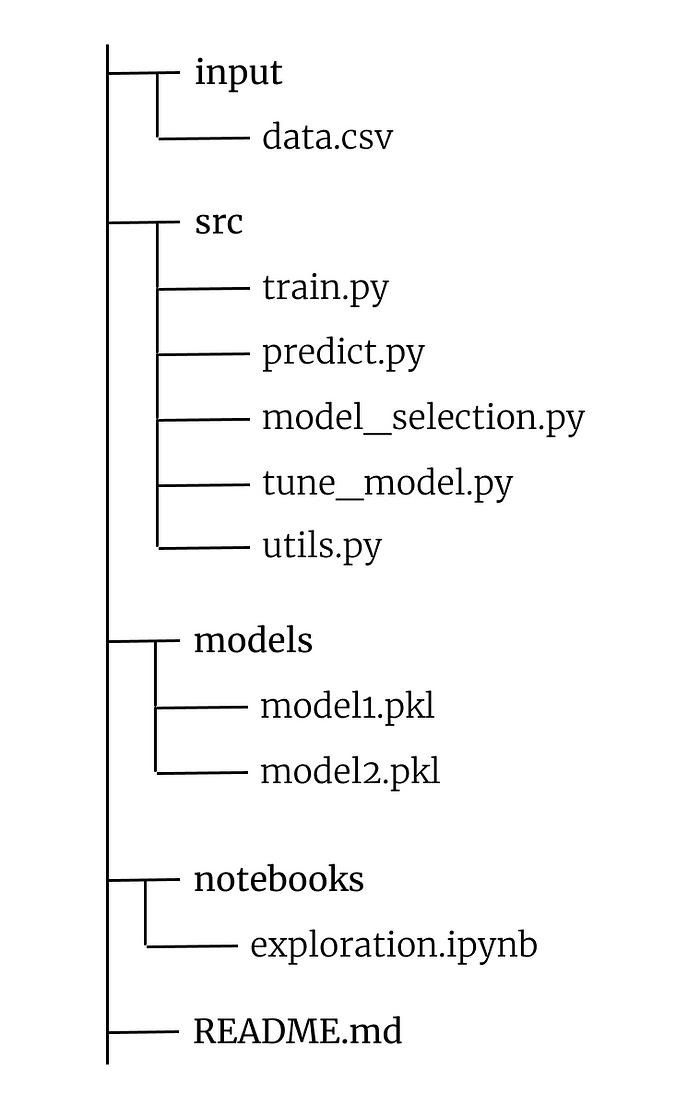
*A well-organized project directory. Your new notebook will live in the 'notebooks' folder.*
2. Follow the template above. Copy and paste the relevant code from your previous scripts into the notebook.
3. Write extensive Markdown explanations for each step, focusing on justifying your decisions.
4. Once you are done, go to the menu and select "Kernel" -> "Restart & Run All". This will clear all outputs and run the notebook from top to bottom. If it runs without errors, you have created a reproducible piece of analysis!
5. Save your notebook.
Conclusion
Congratulations! By documenting your work in a structured and professional Jupyter Notebook, you have transformed your code into a powerful portfolio piece. You have not only demonstrated your technical ability to build an end-to-end ML system but also your skill in communicating your process and findings effectively.
Key Takeaways:
- A project notebook should tell a story, structured around the problem, results, process, and conclusion.
- Markdown is essential for building the narrative and explaining your code and visualizations.
- Justifying your decisions (e.g., why you chose a specific algorithm or evaluation metric) is critical for demonstrating deep understanding.
- Always ensure your notebook is reproducible by using the "Restart & Run All" feature.
In our final lesson of this module, we will put the finishing touches on your project by creating a professional README.md file and publishing the entire project to your GitHub portfolio.