Welcome to the final lesson of our SQL module! Over the past few lessons, you've progressed from writing basic queries to mastering advanced techniques like window functions, Common Table Expressions (CTEs), and complex behavioral analyses like user retention. You've built a formidable toolkit for data manipulation and aggregation.
Today, we bring all of these skills together for your first portfolio project. Your learning outcome is to analyze a relational dataset to produce a short report of actionable insights. This is where your technical SQL abilities translate into tangible business value. We will move beyond just writing code to focus on the entire analytical process: framing a business problem, structuring a complex analysis, deriving meaningful conclusions, and communicating them effectively.
1. From Data to Actionable Insights
In data analysis, an "insight" is more than just a fact. It's an observation that suggests a specific action or reveals an opportunity.
- Observation: "We have 14,000 new customers this year."
- Actionable Insight: "The majority of our customers are 'New,' but their average monthly spend is 80% lower than 'VIP' customers. This indicates a significant opportunity to increase revenue by improving new customer engagement and average order value."
An actionable insight connects the "what" (the data) to the "so what" (the business implication) and leads to the "now what" (the recommendation). Your goal in this project is to produce these kinds of powerful, data-driven conclusions.
2. The Analytical Workflow: A Case Study
We will follow a structured approach to build a comprehensive customer analysis report. The video below provides a fantastic, real-world example of how a data analyst builds a complex report from scratch. We will use it as our guide.
First, you'll need the dataset and a database environment. The video provides all the necessary files and setup instructions. You can use any SQL environment you are comfortable with, such as PostgreSQL with pgAdmin, or the SQL Server setup shown in the video.
SQL Data Analyst Portfolio Project | Like I Do in My Real Projects
This video by "Data with Baraa" will be our primary guide. The first step is to set up your database.
Watch the section on setting up the project. Follow the instructions to download the project files and create the database with the provided tables (customer, product, sales). Choose whichever of the three setup methods works best for you.
With your environment ready, let's start the analysis. A common strategy for tackling complex queries, which should resonate with your programming background, is to use CTEs to create modular, readable steps. We'll build the report in three stages:
- Base Data Preparation: Join tables and perform initial transformations.
- Aggregation: Calculate key metrics per customer.
- Segmentation & KPI Calculation: Derive insights and final metrics.
The video below walks through this entire process to create a detailed customer report.
SQL Data Analyst Portfolio Project | Like I Do in My Real Projects
This section is the core of our lesson. It demonstrates how to build a sophisticated customer report using multiple CTEs.
Follow along from building the customer report. As you watch, focus on the structure of the query: First CTE (base_query): Notice how he joins the necessary tables (fact_sales, dim_customer) and performs basic data cleaning and transformation, like creating a full customer name and calculating age. This prepares a clean foundation. Second CTE (customer_aggregation): This CTE builds on the first, grouping the data by customer to calculate core aggregate metrics like total_orders, total_sales, and lifespan (the time between first and last order). Final SELECT Statement: This is where the analysis truly comes to life. He uses the aggregated data to: Create customer segments using CASE statements (e.g., VIP/Regular/New, Age Groups). Calculate advanced KPIs like Recency, Average Order Value (AOV), and Average Monthly Spend. Pause the video as needed to write and run the code yourself. The key is to understand how each CTE builds upon the last to manage complexity and arrive at the final, rich dataset.
3. Structuring Your Report
Having a powerful SQL query is only half the battle. The final deliverable is a report that communicates your findings. A good report is clear, concise, and focused on business impact.
The image below shows a high-level structure for a data analysis report.
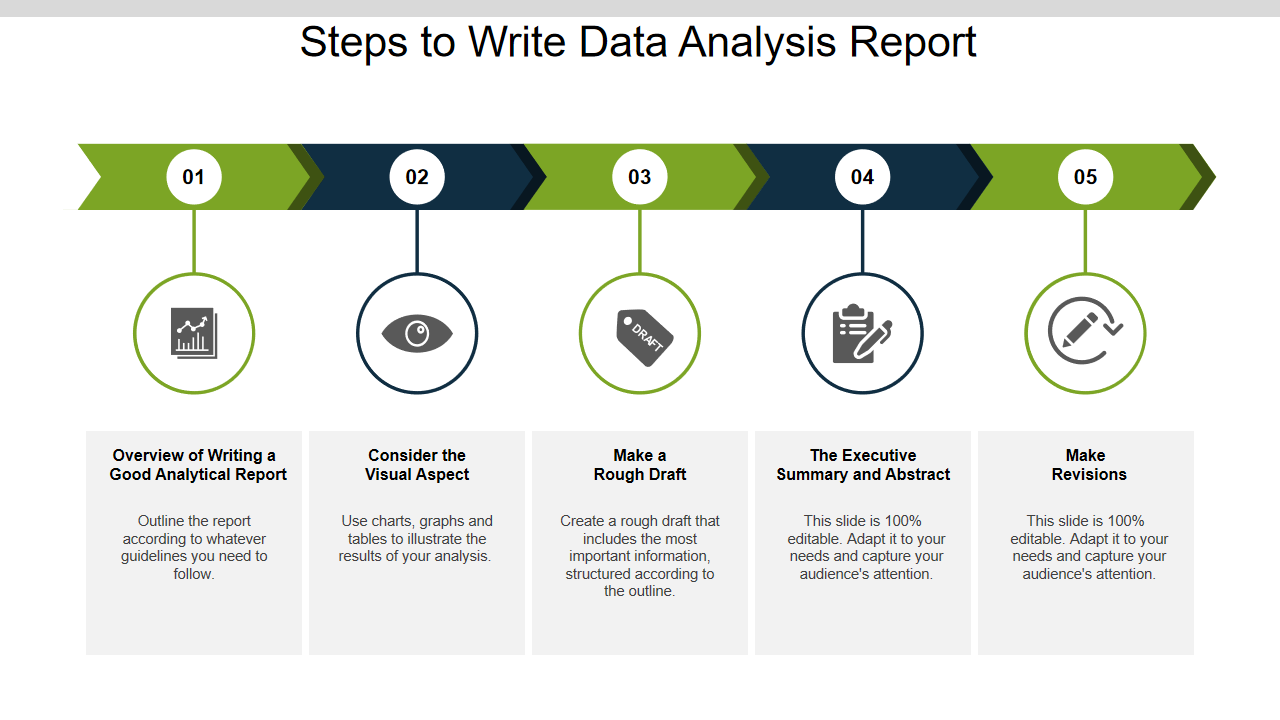
For your portfolio, you'll typically write this report in a README.md file in your GitHub repository. The following reading provides an excellent, practical template for structuring such a write-up.
Data Analysis Project Guide: How to Structure and Present ...
This guide from "Data with Sarah" explains how to create a professional and effective project write-up.
Read through the following sections to understand the key components of your report: Project Context and Define the Problem or Question: Start by explaining the "why." What business question are you answering? Key Findings: Present your most important conclusions upfront. Don't make the reader wait. Walk Through Your Process: Briefly describe your analytical approach. Explain the logic of your CTEs and segmentations. Main Takeaways and Reflections/Next Steps: Detail your insights and recommend what the business should do next based on your findings.
A well-structured report, based on a solid SQL analysis, is exactly what hiring managers look for in a portfolio project. It demonstrates not only technical skill but also business acumen and communication ability.
4. Your Turn: The Product Analysis Report
Now it's time for you to apply this entire workflow to a new problem. Using the same dataset, your task is to create a Product Performance Report. This will be the first major project for your portfolio.
Business Problem: The management team wants to understand which products are driving the business and which are underperforming. They need a report that provides insights into product sales, costs, and popularity to guide inventory, pricing, and marketing decisions.
Your Task:
Write a single, well-structured SQL query (using CTEs) to generate a product report. Then, write a short report in a README.md file that summarizes your findings and provides actionable recommendations.
Guiding Questions for Your Analysis:
Your SQL query should help answer questions like:
- What are the top-selling products by total sales and total quantity?
- How do product costs vary across different categories? Can you create cost segments (e.g., 'Low Cost', 'Medium Cost', 'High Cost')?
- What is the relationship between a product's cost and its sales volume? Are expensive products selling well?
- Which products have the highest reorder rates (if you can calculate this from the data)?
- What is the overall sales performance by product category and subcategory?
Deliverables:
- A single
.sqlfile containing your final, commented query. - A
README.mdfile structured according to the guide you read, including:- The business problem.
- Your key findings and main takeaways.
- Actionable recommendations for the business (e.g., "Discontinue products in the bottom 10% of sales," or "Promote high-margin products to the 'VIP' customer segment we identified earlier").
- A brief overview of your analytical process.
The "Data with Baraa" video you watched actually concludes by setting up this exact challenge. You can refer to the final minutes of the video (
Conclusion
Congratulations on reaching the final project of the SQL module! You've successfully navigated the path from fundamental queries to building a complete, insight-driven analysis that has real business application.
Key Takeaways:
- Actionable insights are the goal of data analysis; they connect data to business decisions.
- CTEs are essential for structuring complex queries, making them readable, and breaking down a problem into logical steps.
- A full analysis involves preparation (joining, cleaning), aggregation (calculating metrics), segmentation (
CASEstatements), and KPI calculation. - A well-structured report (like a GitHub
README.md) is crucial for communicating your findings and demonstrating your value as an analyst.
This project concludes our deep dive into SQL. You now possess the skills to extract and analyze data from complex relational databases to answer critical business questions.
In the next module, Data Science Foundations: NumPy and Pandas, we will shift our focus to Python. You'll learn the fundamental libraries that form the backbone of nearly all data science and machine learning work in the Python ecosystem, enabling you to perform even more flexible and powerful analyses.