Welcome to the next lesson in our SQL module. In our previous session, we mastered the CASE statement and the powerful technique of conditional aggregation to pivot data and create custom reports. You learned how to transform data from a "long" to a "wide" format, a critical skill for clear and concise reporting.
Today, we will apply these advanced skills to solve one of the most common and important business problems in data science: user retention and churn analysis. We'll define what these metrics mean, why they are crucial for any business, and how to construct the SQL queries needed to calculate them. This lesson will bring together JOINs, date functions, and the conditional logic you've just learned to tackle a realistic analytical challenge.
1. Understanding Retention and Churn
Before we write any code, let's define our key terms.
- Retention measures a business's ability to keep its customers over a period. A high retention rate means customers are finding value and sticking around.
- Churn is the opposite of retention. It measures the rate at which customers stop doing business with a company. A high churn rate can be a signal of problems with a product, service, or pricing.
Essentially, retention and churn are two sides of the same coin. Analyzing them helps businesses understand customer loyalty, predict revenue, and identify areas for improvement.
The following video provides an excellent introduction to these concepts and why they matter.
Customer Retention and Churn Analysis (Part 1/2) | SQL Interview Question Product Based Companies
This video by Ankit Bansal clearly introduces the business context for customer retention and churn analysis.
Watch from the beginning to the end of the introduction. Pay attention to the real-world examples given, like loyalty programs and subscription services, which are all designed to improve retention.
A comprehensive churn analysis often results in a dashboard that summarizes key findings for business stakeholders. The image below shows an example from a telecom company.

2. Calculating Month-over-Month Retention
The most straightforward way to start is by calculating month-over-month retention. The core question we want to answer is: "Of the customers who were active last month, how many were also active this month?"
To answer this in SQL, we need to compare two sets of transactions: those from the current month and those from the previous month. This is a perfect use case for a self-join, where we join a table to itself.
The logic is as follows:
- Alias the transaction table as
this_month. - Alias the same transaction table again as
last_month. - Perform a
LEFT JOINfromthis_monthtolast_monthon two conditions:- The
customer_idmust be the same. - The month of
last_month.order_datemust be exactly one month beforethis_month.order_date.
- The
- Group by the current month and count the distinct customers who successfully joined from the
last_monthtable.
The following video provides a brilliant, step-by-step walkthrough of building this query.
Customer Retention and Churn Analysis (Part 1/2) | SQL Interview Question Product Based Companies
Let's return to Ankit Bansal's video. He will now define the monthly retention metric, walk through a manual example, and then translate that logic into a SQL query.
First, watch his definition of the retention period to understand the specific logic we're implementing. Next, follow his manual calculation with the sample data. This helps clarify exactly what the SQL query should produce. Finally, watch the core section where he builds the SQL query. Pay close attention to his explanation for using a LEFT JOIN instead of an INNER JOIN. This is a critical detail for ensuring your report includes months with zero retention.
The key to his query is the LEFT JOIN combined with the DATEDIFF function and counting the customer IDs from the right table (last_month). Because of the LEFT JOIN, if a customer from the current month has no activity in the prior month, the columns from last_month will be NULL. COUNT(DISTINCT last_month.cust_id) will therefore only count the customers who were present in both periods.
3. Calculating Month-over-Month Churn
Now, let's calculate churn. A customer has churned if they were active last month but are not active this month. We can cleverly adapt our retention query to find these users.
The logic is almost the reverse:
- Our main table will be
last_month. - We will
LEFT JOINtothis_month. - We are looking for customers who were present in
last_monthbut have no matching entry inthis_month. This means the columns fromthis_monthwill beNULL. - We can find these churned customers by filtering for
WHERE this_month.customer_id IS NULL.
The second video in the series walks through this modification.
Customer Retention and Churn Analysis (Part 2/2) | SQL Interview Question Product Based Companies
This video is the second part of the series and focuses on calculating churn.
Watch the initial explanation of churn to see how it's the inverse of retention. Observe how he swaps the tables in the LEFT JOIN to change the query's focus from retention to churn. Finally, follow the detailed query walkthrough. The key is the WHERE this_month.cust_id IS NULL clause, which isolates the churned customers.
This self-join pattern is extremely powerful for period-over-period analysis, not just for users but for products, regions, and any other entity you want to track over time.
4. A More Powerful Approach: Cohort Analysis
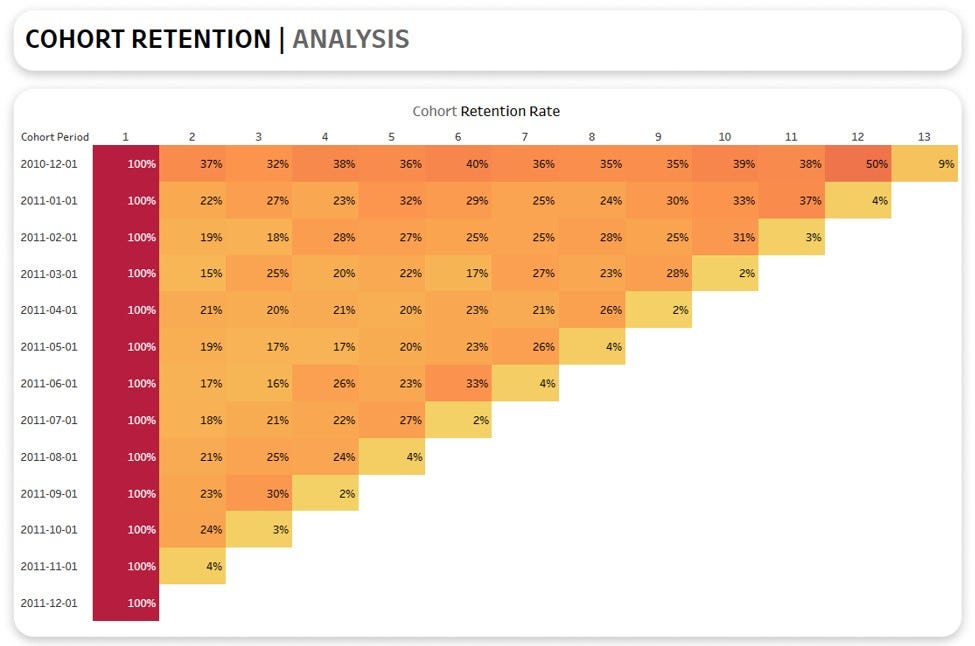
While month-over-month analysis is useful, it can be misleading. It mixes brand-new users with long-time loyal customers, making it hard to see the true health of the user base. A more robust method is cohort analysis.
A cohort is a group of users who share a common characteristic. In retention analysis, this is typically the month or week they signed up or made their first purchase. For example, everyone who signed up in January 2023 forms the "January 2023 cohort."
By tracking each cohort's activity over time, you can answer deeper questions:
- Are newer users sticking around longer than older users?
- Did a new feature launch in March improve retention for all subsequent cohorts?
- How long does it take for a typical user to stop using the product?
The output of a cohort analysis is often a triangular table or a heatmap, showing what percentage of each cohort remains active in the months following their start date.
To learn more about the different types of retention metrics and why cohort analysis is so valuable, the following reading is highly recommended.
Retention in SQL: How to Calculate User and Cohort ...
This article from StrataScratch provides a deep dive into retention analysis, framing it in the context of data science interviews.
Start with the section "What Does Retention Actually Mean?" for a clear definition. Read "Interview Framing: How is Retention Tested in Interviews?" This will give you insight into the kinds of questions you can expect and the different "flavors" of retention. Finally, read the section on "Cohort Retention in SQL". Focus on the three conceptual steps it outlines: (1) Assigning users to cohorts, (2) Joining activity to the cohort, and (3) Calculating the period offset.
The article you just read explains the "what" and "why" of cohort analysis. To see the "how," let's look at a complete SQL implementation. The query below calculates annual retention for Stack Overflow users. While it looks complex, it follows the exact logic you've been learning: using CTEs to break down the problem, a window function to find the first activity date, and conditional aggregation to pivot the results.
Retention / Churn Analysis with SQL
This article by Sam Brand provides a full, commented SQL query for performing cohort retention analysis on a public dataset.
Read the section "Stack Overflow User Retention". Do not worry about running the query yourself. Instead, focus on understanding its structure. Look at the first_year CTE. It uses FIRST_VALUE() OVER (...) to find the first year a user posted an answer. This is the step that defines the cohort. Look at the yr_number CTE. It uses DATE_DIFF() to calculate the time difference between the current activity and the first activity. This creates the "Month 1, Month 2, ..." dimension. Finally, look at the data_a CTE. It uses COUNT(DISTINCT CASE WHEN ...) to pivot the data, exactly like you learned in the previous lesson.
This example demonstrates how the SQL skills you've been building—CTEs, window functions, and CASE statements—all come together to solve a sophisticated, real-world business problem.
5. Practice Exercises
Let's use a simplified user_logins table to practice these concepts.
user_id |
login_date |
|---|---|
| 1 | '2023-01-05' |
| 2 | '2023-01-10' |
| 1 | '2023-01-15' |
| 3 | '2023-01-20' |
| 1 | '2023-02-05' |
| 3 | '2023-02-20' |
| 2 | '2023-03-10' |
| 3 | '2023-03-25' |
Note: For simplicity, let's define "monthly activity" as a user having at least one login in that calendar month. The DATE_TRUNC('month', login_date) function will be very helpful.
Problem 1: Monthly Active Users
First, write a query to find the number of unique active users for each month (Jan, Feb, Mar 2023).
Solution
SELECT
  DATE_TRUNC('month', login_date) AS login_month,
  COUNT(DISTINCT user_id) AS active_users
FROM user_logins
GROUP BY 1
ORDER BY 1;

-- Expected Output:
-- login_month | active_users
-- 2023-01-01  | 3
-- 2023-02-01  | 2
-- 2023-03-01  | 2
Problem 2: Calculate Retained Users for February
How many users who were active in January were also active in February? Use the self-join pattern.
Solution
WITH monthly_activity AS (
  SELECT DISTINCT
    user_id,
    DATE_TRUNC('month', login_date) AS activity_month
  FROM user_logins
)
SELECT
  COUNT(DISTINCT this_month.user_id) AS retained_users
FROM monthly_activity AS this_month
JOIN monthly_activity AS last_month
  ON this_month.user_id = last_month.user_id
  AND this_month.activity_month = last_month.activity_month + INTERVAL '1 month'
WHERE this_month.activity_month = '2023-02-01';

-- Expected Output:
-- retained_users
-- 2
-- (Users 1 and 3 were active in Jan and Feb)
Problem 3: Calculate Churned Users in March
How many users who were active in February did not log in at all in March?
Solution
WITH monthly_activity AS (
  SELECT DISTINCT
    user_id,
    DATE_TRUNC('month', login_date) AS activity_month
  FROM user_logins
)
SELECT
  COUNT(DISTINCT feb_users.user_id) AS churned_users
FROM monthly_activity AS feb_users
LEFT JOIN monthly_activity AS mar_users
  ON feb_users.user_id = mar_users.user_id
  AND mar_users.activity_month = '2023-03-01'
WHERE
  feb_users.activity_month = '2023-02-01'
  AND mar_users.user_id IS NULL;

-- Expected Output:
-- churned_users
-- 1
-- (User 1 was active in Feb but not in March. User 3 was active in both. User 2 was not active in Feb.)
Conclusion
In this lesson, you moved beyond theoretical SQL syntax to tackle a core business analytics problem. You learned how to define and calculate user retention and churn, two vital metrics for measuring business health.
Key Takeaways:
- Retention and churn are critical metrics for understanding customer loyalty.
- A self-join is a standard pattern for performing period-over-period analysis, like calculating month-over-month retention.
- The
LEFT JOIN ... WHERE key IS NULLpattern is the corresponding technique for identifying churned users. - Cohort analysis provides a more nuanced and powerful view of retention by tracking specific user groups over their entire lifecycle.
- Complex analyses like cohort retention are built by combining simpler SQL building blocks: CTEs, window functions (
FIRST_VALUE), and conditional aggregation (SUM(CASE WHEN)).
You now have a solid foundation for performing sophisticated behavioral analysis in SQL. In the next lesson, we will focus on the final steps of your SQL project: analyzing a relational dataset to produce a short report of actionable insights, structuring your queries for clarity, and preparing your work for your portfolio.