Welcome back! In our last lesson, we explored SHAP summary and dependence plots to understand how our model's features influence its predictions on a global scale. We saw which features have the most impact and how their effects can interact.
Now, we'll take the next logical step. Knowing how features work is one thing; knowing where and why your model fails is another. This lesson focuses on systematic error analysis, a crucial discipline for moving beyond a single accuracy score to truly understand and improve your model. You will learn to pinpoint specific data subsets where your model consistently makes mistakes, diagnose the potential causes, and prioritize your efforts to fix them.
1. Beyond a Single Metric: The "Why" of Error Analysis
Imagine you've built a model with 80% accuracy. While this number gives you a general sense of performance, it hides a critical story. Is the 20% error rate distributed evenly, or is your model failing spectacularly on a specific, important subgroup of your data? Systematic error analysis is the process of answering this question.
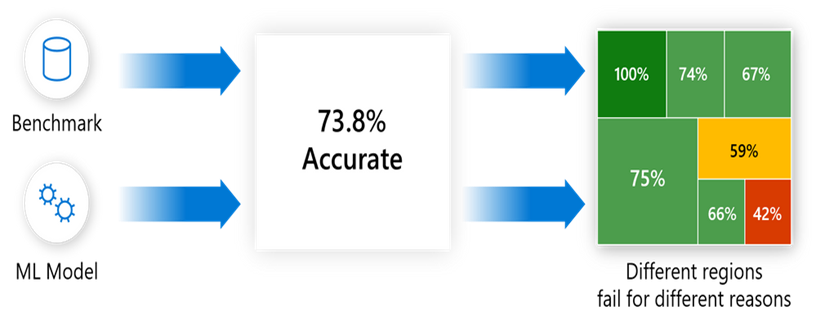
By breaking down errors, you can:
- Prioritize your work: Focus your time and resources on fixing problems that will actually improve performance, rather than chasing minor issues.
- Build trust and fairness: Ensure your model performs reliably for all user groups, not just the majority.
- Generate ideas for model improvement: The nature of the errors often points directly to solutions, such as feature engineering, data collection, or addressing data quality issues.
The core idea, as articulated by Andrew Ng, is to turn the "black magic" of model improvement into a systematic engineering discipline.
2. A Practical Workflow for Manual Error Analysis
One of the most powerful and insightful ways to begin error analysis is by manually inspecting your model's mistakes. This hands-on approach builds deep intuition about your model's behavior.
Andrew Ng provides a clear, actionable workflow for this process.
Carrying Out Error Analysis (C3W2L01)
In his video "Carrying Out Error Analysis," Andrew Ng demonstrates a simple yet powerful technique for understanding model failures.
Watch the entire video. Pay close attention to these key ideas: Calculating the ceiling: Note how he quantifies the maximum possible improvement from fixing a specific error type (the "dog problem"). This is crucial for prioritization. The spreadsheet method: Observe how he uses a simple table to evaluate multiple error categories at once, allowing for a structured comparison of potential improvement strategies.
Let's formalize the workflow from the video:
Step 1: Get a Sample of Misclassified Examples
From your development or test set, collect a manageable number of examples that your model got wrong (e.g., 100).
Step 2: Manually Review and Categorize Errors
Create a spreadsheet or table to track your findings. For each misclassified example, look at the input data, the true label, and the predicted label. Then, create columns for potential error categories.
For example, if you were building a credit default prediction model, your table might look like this:
| Example ID | True Label | Predicted Label | Low Income? | Self-Employed? | Short Credit History? | Comments |
|---|---|---|---|---|---|---|
| 734 | Default | No Default | ✓ | ✓ | Applicant is a recent graduate. | |
| 1052 | No Default | Default | ✓ | High income, but from a volatile industry. | ||
| 2110 | Default | No Default | ✓ | Incorrectly entered education_level. |
||
| ... | ... | ... | ... | ... | ... | ... |
Notice that you can—and should—create new categories as you discover patterns.
Step 3: Quantify and Prioritize
After reviewing your sample, calculate the percentage of errors that fall into each category.
Self-Employed: 45% of errorsShort Credit History: 30% of errorsLow Income: 15% of errorsIncorrectly entered data: 5% of errors
This analysis provides a clear roadmap. Spending a month developing features to better handle self-employed applicants (45% of errors) has a much higher potential impact than cleaning up data entry issues (5% of errors). You have established a ceiling on how much you can improve the model by tackling each problem.
3. Automating Error Identification
Manual review is fantastic for deep insights, but it can be slow. Tools can help accelerate the identification of problematic data cohorts by automatically slicing the data across different features and calculating error rates for each subgroup.
The output of such a tool often looks like a decision tree, where each leaf node represents a data subset with a specific error rate.

The following reading from Microsoft Research demonstrates this process using their Responsible AI toolkit on the well-known UCI Adult Income dataset.
Responsible AI Mitigations and Tracker: New open-source ...
This article outlines a systematic four-part process for responsible AI: Identification, Diagnosis, Mitigation, and Tracking. We will focus on the first part.
Read the introduction and Part 1: Identification. Focus on how they use the Responsible AI Dashboard to move from an overall error rate (21.1%) to identifying specific, high-error cohorts, such as "married individuals with a number of years of education higher than 11" where the error rate jumps to 58.1%.
This automated approach helps you quickly find the "hotspots" in your data where the model is struggling, which you can then investigate more deeply.
4. From Identification to Diagnosis
Once you've identified a failing cohort (e.g., "married individuals with education > 11 years"), the next step is to diagnose the underlying cause. Why is the model failing for this specific group?
The diagnosis could be anything from data quality issues to inherent complexities the model hasn't captured. Let's continue with the Microsoft Research article to see a great example of diagnosis.
Responsible AI Mitigations and Tracker: New open-source ...
Now that a failing cohort has been identified, the authors investigate why.
Read Part 2: Diagnosis. The key insight here is the hypothesis they form: the failing cohort has a completely different class imbalance compared to the overall dataset. This is a brilliant example of a data-driven diagnosis.
This diagnostic step is where you connect the "what" (the failing cohort) with the "why" (the potential root cause). Other common root causes to investigate include:
- Poor Data Quality: Are there more missing values or incorrect labels for this subgroup? (See LINK, "Data" section)
- Feature Representation: Are your features failing to capture important information for this cohort?
- Data Leakage: Did you inadvertently leak information into your training set that doesn't exist for this cohort? (See LINK, "Features" section)
- Concept Drift: Has the underlying data distribution for this cohort changed over time?
5. Error Analysis in Complex Pipelines
So far, we've treated the model as a single block. However, many real-world ML systems are multi-component pipelines. For example, a face recognition system might have separate components for:
- Background removal
- Face detection
- Eye segmentation
- The final classification model
If the overall system performs poorly, how do you know which component is the bottleneck? You can apply a powerful form of error analysis by simulating a "perfect" version of each component.
Lecture 13 - Debugging ML Models and Error Analysis | Stanford CS229: Machine Learning (Autumn 2018)
In this lecture from his Stanford course, Andrew Ng explains how to attribute error in a multi-stage machine learning pipeline.
Watch the segment on error analysis for pipelines. The key technique is to manually provide the ground-truth output for one component at a time (e.g., use Photoshop for perfect background removal) and measure the impact on the final system accuracy. This tells you the maximum possible gain from improving that specific component.
This technique is incredibly valuable as it allows you to precisely attribute error and allocate engineering resources in complex systems—a skill highly relevant to building end-to-end projects.
Conclusion
In this lesson, you have learned how to go beyond a single performance metric and systematically investigate your model's failures. This is a cornerstone skill of a professional data scientist.
Key Takeaways:
- Systematic Error Analysis is a structured process to find and understand data subsets where your model performs poorly.
- A practical workflow is to Identify failing cohorts (manually or with tools) and then Diagnose the root causes by forming hypotheses about the data or model.
- Quantifying the "ceiling" for improvement—the maximum gain from fixing a category of errors—is essential for prioritizing your work.
- For multi-component pipelines, you can attribute error by feeding "perfect" ground-truth data into each component sequentially and observing the change in overall accuracy.
You now have the tools to identify where your model is going wrong. In our next lesson, we will focus on the "mitigation" step: using these error analysis findings to guide concrete feature engineering and model improvements.