Welcome to the first lesson in our module on Model Explainability and Deployment. In the previous module, we focused on building and selecting high-performing models. You learned how to systematically compare algorithms like Random Forest and Gradient Boosting and discovered that these powerful ensemble models often provide the best predictive accuracy.
However, a model with high accuracy isn't always enough. To trust and act on a model's predictions, we need to understand why it makes them. This lesson marks our first step into model interpretability. We will focus on answering a crucial question: which features in our data did the model find most useful for making its predictions? You will learn how to extract and interpret feature importance scores specifically from tree-based models, a skill that is essential for debugging models, deriving business insights, and communicating your findings to stakeholders.
1. The Intuition Behind Feature Importance
After training a model like a Random Forest, we often want to know which factors drove its decisions. Did it rely more on a customer's age or their monthly spending? Was the departure delay or the scheduled flight time more critical in predicting an arrival delay? Feature importance is a score assigned to each input feature that indicates its relative contribution to the model's predictive power.
For tree-based models, the most direct way to calculate this is by looking at how the model is constructed.
A decision tree builds itself by repeatedly asking questions about features to split the data. At each node, it selects the feature and threshold that lead to the "purest" possible child nodes—that is, the split that does the best job of separating the data into distinct classes. The more a feature is used to make these key splits, and the more those splits reduce impurity (like Gini impurity or entropy), the more important that feature is considered to be.
To understand this foundational concept, let's watch a segment from a video by Sebastian Raschka.
13.3.2 Decision Trees & Random Forest Feature Importance (L13: Feature Selection)
This video, "Decision Trees & Random Forest Feature Importance," provides an excellent intuition-first explanation of how decision trees inherently perform feature selection.
Watch the first part of the video from the decision tree example. Focus on the core idea that a tree decides which feature to use for a split based on which one will decrease the impurity (entropy, in this case) the most. A feature that causes a large drop in impurity is, by definition, important for the model's decision-making process.
2. Impurity-Based Importance in Scikit-Learn
The concept we just saw for a single tree is extended to a Random Forest by a simple but powerful idea: a feature's importance in the forest is the average of its importance across all the individual trees. This method is often called Mean Decrease in Impurity (MDI).
Because this calculation uses the internal structure of the model, it's very fast to compute. In scikit-learn, you can access these scores directly from a trained model using the .feature_importances_ attribute.
Let's look at a practical example of how to access and visualize these scores.
Feature importances with a forest of trees
This scikit-learn official example provides a clear and concise demonstration of calculating and plotting impurity-based feature importance.
Read through the page down to the first plot. Pay close attention to these parts: Data generation and model fitting: Notice the setup where a RandomForestClassifier is trained on some data. Feature importance based on mean decrease in impurity: This is the key section. See how the forest.feature_importances_ attribute is accessed after the model is fit. Plotting code: Observe how pandas and matplotlib are used to create a bar chart that visualizes the importance scores, making them easy to interpret. The code is self-contained, and you are encouraged to run it in a notebook to solidify your understanding.

This impurity-based method is the default and most common way to get a quick look at what your model has learned. However, it has some significant limitations that you must be aware of.
3. The Caveats of Impurity-Based Importance
While fast and intuitive, MDI has two main issues that can make it misleading:
- Bias Towards High-Cardinality Features: MDI tends to inflate the importance of features with many unique values (high cardinality). This includes continuous numerical features or categorical features with many levels. The model has more options for splitting on such features, which can artificially boost their importance score.
- Dilution of Importance for Correlated Features: If two or more features are highly correlated and contain similar information, the model can randomly pick either one for a split. As a result, the total importance that should be attributed to the underlying signal gets "split" or "diluted" among these features, causing each to appear less important than it actually is.
The following video segment explains these caveats in more detail.
13.3.2 Decision Trees & Random Forest Feature Importance (L13: Feature Selection)
Let's return to Sebastian Raschka's video to understand the mechanics and the pitfalls of this method.
Watch these two segments: First, watch how MDI is calculated. This will formalize the intuition we built earlier, explaining that it's the average impurity decrease weighted by the number of samples at each node. Next, watch the segment on the caveats. The discussion on categorical variables and correlated features is particularly important for you to be aware of when using this method in practice.
Given these potential issues, we need a more reliable method.
4. A More Robust Method: Permutation Importance
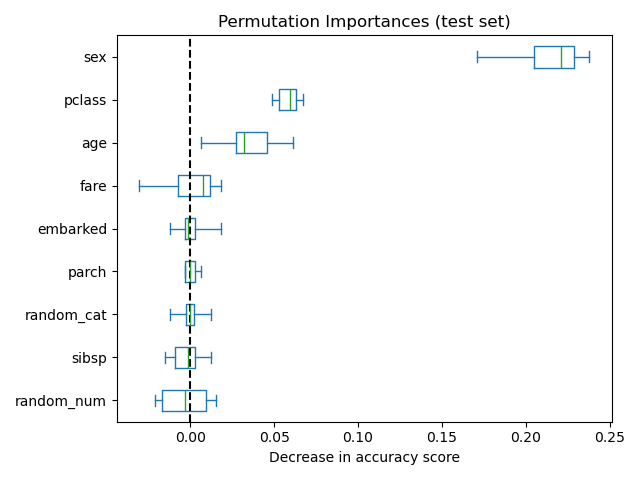
Instead of looking at the model's internal structure, Permutation Feature Importance takes a different approach. It determines a feature's importance by directly measuring how much the model's performance drops when that feature's information is "destroyed."
The process is as follows:
- Train a model and evaluate its performance (e.g., accuracy, R², F1-score) on a held-out test set. This is your baseline score.
- Take one feature column in the test set and randomly shuffle its values. This breaks the relationship between that feature and the target variable, effectively making it useless.
- Pass this modified test set back through the trained model and re-calculate its performance.
- The feature's importance is the difference between the baseline score and the score on the shuffled data. A large drop in performance implies the feature was very important.
- Repeat this process for every feature in the dataset.
This method is more computationally expensive but has several key advantages:
- It is model-agnostic (it works with any fitted model, not just trees).
- It does not have a bias towards high-cardinality features.
- By calculating it on a hold-out test set, it reflects the feature's importance on unseen data, which is less prone to being misled by model overfitting.
The following article demonstrates the superiority of permutation importance over the default MDI method with a compelling example.
Calculate & Interpret Model Feature Importance
This article from Towards Data Science clearly illustrates the problem with the default method and the solution offered by permutation importance.
Read the first two sections, "The trouble with Default Feature Importance" and "Permutation Importance to Rescue." The author adds two random features to the Titanic dataset. The default impurity-based method incorrectly assigns them a moderate level of importance. In contrast, permutation importance correctly identifies them as having virtually zero importance. This practical demonstration highlights why permutation importance is generally the more trustworthy approach.
5. Best Practices for Interpretation
Now that you know two methods for calculating feature importance, here is a practical workflow:
-
Start with a Robust Model: Feature importances are only as reliable as the model they come from. A heavily overfit model might assign high importance to noisy features it has "memorized." As demonstrated in the
towardsdatascience.comarticle (in the section "A Robust Model is a Prerequisite for Accurate Importance Scores"), ensuring your model generalizes well (e.g., by tuningmin_samples_leafor other regularization parameters) is the first step to getting meaningful importances. -
Prefer Permutation Importance: While
.feature_importances_is useful for a quick check, you should rely onsklearn.inspection.permutation_importancecomputed on a test set for your final analysis and reporting. -
Handle Correlated Features: Permutation importance can still split importance across collinear features. Before finalizing your interpretation, check for highly correlated features (e.g., using a correlation heatmap). If two features like
pclassandfareare highly correlated and both show moderate importance, their combined effect is likely very significant. You might consider discussing them as a single "socio-economic" group or removing one of them, as suggested in the "Dealing with Collinear Features" section of thetowardsdatascience.comarticle.
Conclusion
In this lesson, you've learned how to look inside a trained tree-based model to understand which features are driving its predictions. This is a fundamental skill in model interpretation.
Key Takeaways:
- Feature importance scores quantify how much each feature contributes to a model's predictive power.
- Impurity-based importance (MDI) is a fast, built-in method for tree models (
.feature_importances_) but can be misleading due to biases towards high-cardinality features and issues with correlated features. - Permutation importance is a more robust, model-agnostic method that measures the performance drop when a feature is shuffled. It is the recommended approach for reliable interpretation.
- Always calculate importance on a held-out test set to get a realistic assessment of a feature's value on unseen data.
- Be mindful of correlated features when interpreting results, as their importance may be distributed among them.
Feature importance gives us a high-level, "global" view of what the model learned. However, it doesn't tell us how a feature affects an individual prediction. For example, for a specific person, did their high age increase or decrease their predicted risk score?
In our next lesson, we will dive into SHAP (SHapley Additive exPlanations), a powerful technique that allows us to explain individual predictions and uncover these more nuanced, "local" relationships.