Introduction
Welcome back! In our previous lesson, we established what cloud monitoring is and identified the key metrics for compute, storage, and network resources. We learned that monitoring is like a "health checkup" for your cloud infrastructure, providing the data to verify that services are running as expected.
However, in the world of cloud operations, you'll frequently encounter three distinct but related terms: monitoring, observability, and alerting. While they are often used interchangeably, they represent different concepts and capabilities. For your exams, being able to precisely define and differentiate them is crucial.
This lesson is designed to do exactly that. We will dissect each term to fully address the learning outcome: Explain the difference between cloud monitoring, observability, and alerting.
1. Monitoring vs. Alerting: Data vs. Action
Let's begin with the most fundamental distinction: the relationship between monitoring and alerting.
As we learned previously, monitoring is the process of collecting and visualizing data about a system's health and performance. Think of the dashboard we saw, showing graphs of CPU utilization and network traffic.
Alerting, on the other hand, is the mechanism that notifies you when that data indicates a problem that requires human intervention.
Monitoring vs Alerting: Key Differences, Best Practices
To get precise, exam-ready definitions, let's start with the article 'Monitoring vs Alerting' from Motadata. It cleanly separates these two concepts.
Please read the sections titled 'What is Monitoring?' and 'What Is Alerting?'. Focus on the purpose of each one. Notice how monitoring is about providing visibility, while alerting is about triggering an action.
Based on the reading, we can establish these core definitions:
- Monitoring: The continuous collection and visualization of data to understand system behavior and health. It is passive and informative.
- Alerting: The mechanism that signals when a predefined condition is met, indicating that someone needs to take action. It is active and interruptive.
The difference lies in intent: monitoring informs, while alerting interrupts. A simple analogy is your car's dashboard:
- The speedometer constantly monitors and displays your speed.
- A warning chime that sounds when you exceed 120 km/h is the alert.
For your exam, presenting the differences in a table is highly effective. The resource you just read provides an excellent comparison.
Key Differences: Monitoring vs. Alerting
| Aspect | Monitoring | Alerting |
|---|---|---|
| Purpose | Observe and understand system behavior | Trigger action when human intervention is needed |
| Audience | Engineers, SREs, analysts (for investigation) | On-call responders |
| Data vs. Signal | Provides raw data and trends (e.g., a graph) | Provides an actionable signal (e.g., an email/SMS) |
| Time Sensitivity | Often retrospective or exploratory | Immediate and urgent |
| Actionability | Passive; provides information | Explicitly actionable; demands a response |
2. What is Observability? The Deeper "Why"
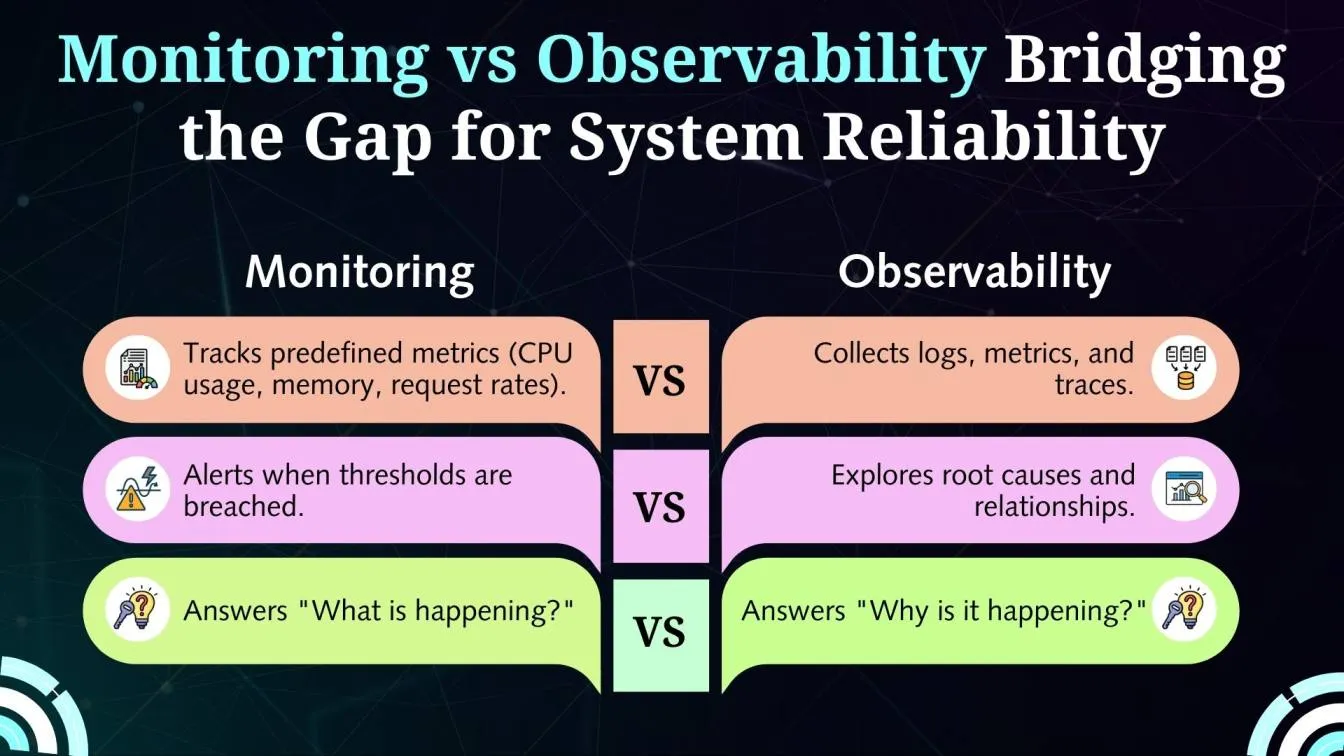
Now, where does observability fit in? If monitoring tells you what is happening (e.g., "CPU utilization is at 95%"), observability is what allows you to understand why it's happening.
Observability is a broader discipline that encompasses monitoring. It is defined as the ability to infer a system's internal state from its external outputs. In complex, distributed cloud systems, you can't always predict every possible failure mode. Observability gives you the tools to explore and debug these "unknown unknowns."
To understand this, let's watch a short video that introduces the concept.
Day-1 | Fundamentals of Observability | Observability Zero to Hero Course
This video from Abhishek.Veeramalla clearly defines observability and explains its purpose through the 'what, why, and how' framework.
Please watch from 06:25 to 12:25. Pay close attention to how observability helps answer three questions: What is the state of the system? Why is it in that state? and How can we fix it?
The Three Pillars of Observability
As the video explained, observability is built on three main types of telemetry data, often called the "three pillars":
-
Metrics: These are numerical measurements collected over time. They are the foundation of traditional monitoring and answer the "what" question.
- Example: CPU utilization is 90%. The error rate is 5%.
-
Logs: These are timestamped, text-based records of discrete events. They provide context and help answer the "why" question.
- Example: A log entry shows an "Out of Memory" error or a "Database connection failed" message that occurred at the same time the CPU usage spiked.
-
Traces (Distributed Tracing): These track a single request as it travels through all the different microservices in a distributed system. They are crucial for debugging and answer the "where" question.
- Example: A trace shows that a user's request was fast in the front-end service but slowed down dramatically during a call to the payment service, which then timed out when contacting the database.
Traditional monitoring often focuses only on metrics. An observable system, however, integrates metrics, logs, and traces, allowing you to move seamlessly from detecting a problem (the "what") to understanding its root cause (the "why" and "where").
3. Comparing Monitoring, Observability, and Alerting
Now let's bring all three concepts together. The key distinction to remember for your exam is:
- Monitoring is for known unknowns. We know that high CPU usage is a potential problem, so we monitor it and set an alert.
- Observability is for unknown unknowns. In a complex system, a new and unexpected issue might arise. Observability gives you the rich data (metrics, logs, and traces) to investigate and understand this novel failure.
This visual diagram clearly illustrates that monitoring is a subset of the broader concept of observability.

Here's another way to visualize the core difference between the questions they help answer.
To solidify this, let's use a powerful analogy.
The following video uses a simple doctor-patient analogy to make the distinction between monitoring and observability very clear and memorable.
Watch the segment from 10:54 to 13:21. Focus on how the heart rate monitor acts as the monitoring/alerting system, while the doctor's full investigation represents observability.
To summarize the analogy:
- Monitoring + Alerting: The heart rate monitor shows a patient's vitals (monitoring) and sounds an alarm when the heart rate spikes (alerting). It tells us what happened.
- Observability: The doctor investigates the alarm by looking at the patient's complete chart—recent activities, medication logs, sleep patterns (the equivalent of metrics, logs, and traces). This allows the doctor to diagnose the why—an allergic reaction to a new medication.
Summary Comparison Table
This table consolidates the differences between all three concepts, which is an ideal format for exam revision.
| Aspect | Monitoring | Alerting | Observability |
|---|---|---|---|
| Purpose | To track the health of a system against known metrics. | To notify humans when a system requires immediate attention. | To understand the internal state of a system and debug complex issues. |
| Primary Question | What is happening? | Should someone act now? | Why is this happening? |
| Scope | Focuses on predefined metrics ("known unknowns"). | A triggered, actionable signal based on a monitored condition. | Explores all telemetry (metrics, logs, traces) to find root causes ("unknown unknowns"). |
| Approach | Reactive. You watch for problems you expect to happen. | Interruptive. Demands an immediate response to a problem. | Proactive & Exploratory. You can investigate issues you did not anticipate. |
| Typical Output | Dashboards, graphs. | Email, SMS, Slack message, PagerDuty notification. | Interactive query tools, correlated views of traces, logs, and metrics. |
Conclusion
In this lesson, we have dissected the distinct roles of monitoring, observability, and alerting in cloud management. Understanding these differences is key to demonstrating a precise and professional grasp of the subject.
Key Takeaways:
- Monitoring is the collection of predefined data (metrics) to tell you what is happening in your system.
- Alerting is the actionable notification, triggered by monitoring data, that tells you to act now.
- Observability is the broader practice of using rich telemetry (metrics, logs, and traces) to explore and understand why something is happening, especially for complex and unpredictable problems.
- In short: Monitoring tells you that something is wrong. Observability helps you figure out what it is. Alerting ensures you know about it in time to fix it.
Preview of the Next Lesson:
Now that we have a solid understanding of how to keep cloud systems healthy and performant, our focus will shift to the financial aspect of cloud computing. In the next lesson, we will address the learning outcome: Define FinOps and explain its role in managing cloud costs. This will introduce you to the practices organizations use to get the most value out of their cloud spending.