Introduction
Welcome to the first lesson in our new module, "System Performance & Scalability Analysis." In the previous modules, we focused on the core mechanics of the kernel: how it boots, manages processes, handles concurrency, allocates memory, and interfaces with hardware like PCIe devices. Our primary goal was to understand how to get things working correctly and how to debug them when they don't.
Now, we shift our focus from correctness to efficiency. It's not enough for a system to work; for embedded systems and high-performance servers, it must work fast. This module will equip you with the tools and methodologies to measure, analyze, and optimize system performance.
This lesson kicks off our journey by introducing the most powerful and versatile profiler in the Linux world: perf. Our learning outcome is to use 'perf' to profile CPU usage, cache misses, and branch mispredictions in kernel and user-space code. You'll learn how perf can see what other tools miss, providing deep insights into your system's behavior with minimal overhead. By the end, you'll be able to answer not just "what is the CPU doing?" but "why is it busy?"
1. Why perf? Beyond Traditional Tools
You're likely familiar with tools like top for monitoring CPU usage. While useful, they have significant limitations. A common problem is identifying the source of CPU load when it's caused by many short-lived processes. Since top samples the process list every few seconds, these fleeting processes can start and finish between updates, leaving you with high CPU usage but no obvious culprit.
This is where perf excels. As a kernel-based sampling profiler, it can be triggered by various events, including a high-frequency timer, to capture a statistical snapshot of what the CPU is executing at any given moment.
To see a demonstration of this exact scenario, please watch the following short video segment.
Linux Performance Troubleshooting Demos
The video 'Linux Performance Troubleshooting Demos' by grobelDev demonstrates a classic case where top is blind to the real cause of high CPU usage. This segment shows how perf is used to instantly identify the short-lived processes responsible.
Watch the section from 07:47 to 10:30. Pay close attention to how top shows high CPU usage but no specific process, and how perf record followed by perf report pinpoints the 'checksum' command as the culprit.
Core Concepts of perf
perf is not just one tool, but a suite of performance analysis tools built into the Linux kernel source tree. It operates in two primary modes:
- Counting (
perf stat): This mode counts the total occurrences of specific events over the lifetime of a command. It's very low overhead and gives you a high-level summary. For example, you can count the total number of instructions executed or cache misses that occurred. - Sampling (
perf record): This is the profiling mode.perfis configured to record a "sample" whenever a specific event occurs. A sample typically includes the instruction pointer (what code was running) and the call stack. By aggregating thousands of these samples,perfbuilds a statistical picture of where the system is spending its time.
Event Sources
The power of perf comes from the wide variety of events it can monitor. These events originate from different levels of the system.
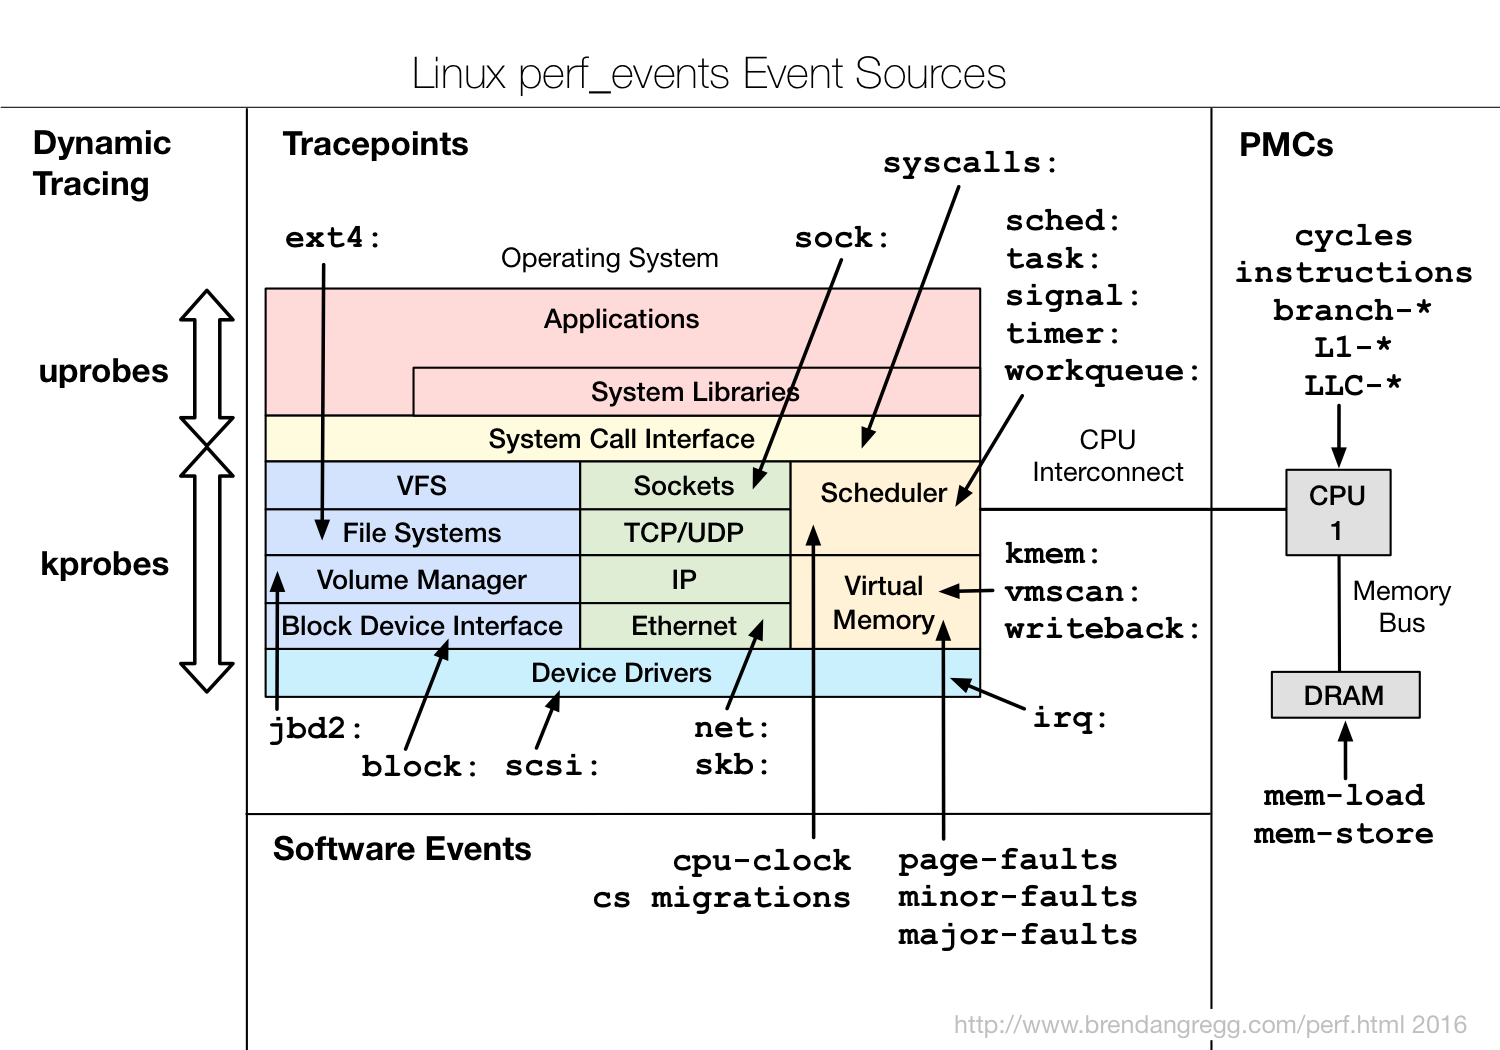
For this lesson, we will focus primarily on two event categories:
- Software Events: Events generated by the kernel, like timer interrupts (
cpu-clock), which are used for general CPU usage profiling. - Hardware Events: Events generated by the CPU's Performance Monitoring Unit (PMU). These are also known as Performance Monitoring Counters (PMCs). They give us direct insight into the microarchitectural behavior of the CPU, such as
cache-missesandbranch-mispredictions.
2. Getting Started: Prerequisites and perf stat
Before diving in, you'll need to install the perf tools, which are usually packaged separately from the kernel. On Debian/Ubuntu systems, this is typically done with:
sudo apt-get install linux-tools-common linux-tools-$(uname -r)
High-Level Analysis with perf stat
Let's start with perf stat. It's the simplest way to get a performance overview of a command. Let's run it on a command that does a fair amount of work, like find / -name "*.c" > /dev/null.
perf stat find / -name "*.c" > /dev/null
You'll see output similar to this:
 Performance counter stats for 'find / -name "*.c" > /dev/null':

      1,234.56 msec task-clock                #    0.998 CPUs utilized
         5,432      context-switches          #    0.004 M/sec
           123      cpu-migrations            #    0.099 K/sec
        45,678      page-faults               #    0.037 M/sec
   3,987,654,321      cycles                    #    3.230 GHz
   2,876,543,210      instructions              #    0.72  insn per cycle
     543,210,987      branches                  #  440.011 M/sec
      21,098,765      branch-misses             #    3.88% of all branches

       1.236012345 seconds time elapsed
Let's break down the key metrics for our learning outcome:
cycles&instructions: These are fundamental PMCs. Their ratio gives you Instructions Per Cycle (IPC). Here, it's 0.72. An IPC greater than 1 suggests the CPU is efficiently executing instructions. An IPC less than 1, especially in CPU-bound code, suggests the CPU is often stalled, waiting for data from memory.cache-misses: This counter (which you can add with-e cache-misses) tells you how many times the CPU needed data that wasn't in its caches, forcing a slow trip to main memory.branch-misses: This shows how often the CPU's branch predictor guessed wrong about the outcome of anifstatement or a loop. Each misprediction causes the pipeline to be flushed and refilled, wasting cycles. A high percentage (like the3.88%here) can be a significant performance drain.
3. Profiling CPU Usage with Timed Sampling
perf stat tells you what happened, but not where in the code it happened. To find the hot spots in your code, we use perf record for sampling. The most common use is timed sampling to profile overall CPU usage.
# Profile the entire system for 10 seconds at 99Hz
sudo perf record -F 99 -ag -- sleep 10
-F 99: Sample at a frequency of 99 Hertz (samples per second). We use 99 instead of 100 to avoid accidentally synchronizing with periodic system tasks, which could skew the results.-a: Sample across all CPUs.-g: Capture a call graph (stack trace) with each sample. This is essential for understanding the context of a function call.-- sleep 10: The command to profile. Here, we're just sleeping, which meansperfwill sample whatever else is running on the system.
This command generates a perf.data file. To analyze it, we use perf report.
perf report
This opens a text-based user interface (TUI). You can navigate with the arrow keys. The main view shows a list of functions sorted by "overhead"—the percentage of total samples in which that function appeared.
The Importance of Symbols and Frame Pointers
When you first use perf report, you might see a lot of hexadecimal addresses instead of function names. For perf to translate these addresses into meaningful names, it needs two things:
- Debug Symbols: Code should be compiled with
-g. For kernel symbols, you may need to install a debug package (e.g.,linux-image-*-dbgsym). - Frame Pointers: Compilers often perform an optimization that omits the frame pointer to free up a register. This breaks the ability of profilers like
perfto walk the stack. You should compile your code with-fno-omit-frame-pointerfor accurate profiling.
For a comprehensive guide on setting up your environment for proper profiling, please review the following resource.
Linux perf Examples - Prerequisites and Stack Traces
Brendan Gregg's 'perf Examples' page is an essential reference. This section details the prerequisites for getting meaningful results from perf, especially regarding symbol translation and stack traces.
Read the sections '4.1. Prerequisites', '4.2. Symbols', '4.3. JIT Symbols (Java, Node.js)', and '4.4. Stack Traces'. Focus on understanding why debug symbols and frame pointers are critical and how to ensure they are available for both user-space applications and the kernel.
Visualizing Profiles with Flame Graphs
While perf report is powerful, navigating large text-based call trees can be cumbersome. Flame Graphs, another invention by Brendan Gregg, provide a powerful and intuitive visualization of profiling data.

Generating a flame graph involves piping the output of perf script into a series of scripts from Gregg's FlameGraph repository. This is a key skill for any serious performance engineer.
4. Profiling Hardware Events: A Practical Scenario
Now let's move beyond general CPU usage to microarchitectural issues. When your code has a low IPC, the cause is often poor cache utilization or frequent branch mispredictions. perf lets you profile these events directly.
Instead of sampling on a timer (-F 99), we'll sample on a hardware counter overflow.
- Cache Misses:
sudo perf record -e cache-misses -c 10000 -g -- ./my_app - Branch Mispredictions:
sudo perf record -e branch-misses -c 10000 -g -- ./my_app
Here, -e specifies the event to sample, and -c 10000 tells the CPU to generate a sample every 10,000 occurrences of that event. Running perf report on the resulting perf.data file will now show you which functions are responsible for the most cache misses or branch mispredictions.
Let's walk through a concrete scenario to see this in action.
Optimization Example: Matrix Multiplication
The presentation 'Performance Analysis and Optimization on Linux' contains an excellent, self-contained example of using perf to diagnose and fix a performance issue in a matrix multiplication program.
Please review slides 35 through 40. Slide 36: Examine the naive matrix multiplication code. Notice the access pattern for m2: m2[k][j]. Since C stores arrays in row-major order, iterating through j in the inner loop means you are jumping through memory in large strides (column-major access). Slide 37-38: Observe how perf annotate pinpoints the multiplication line as the hotspot and the analysis identifies the column-major access as the cause of backend stalls (i.e., cache misses). Slide 40: See the simple fix—inverting the j and k loops—and the resulting performance analysis showing the backend stalls are gone. This is a classic demonstration of identifying and fixing a cache-inefficient memory access pattern.
This scenario demonstrates the full power of perf: it doesn't just tell you that your program is slow; it leads you to the exact line of code and the specific microarchitectural reason (cache misses due to poor memory layout access) for the slowness.
5. Interview Scenario
Interviewer: "I have a data processing application that is CPU-bound, but its performance is much lower than expected. Running perf stat on it reveals an Instructions Per Cycle (IPC) of 0.5. How would you use perf to determine the root cause of this poor performance?"
Click for Analysis
This question tests your ability to form a hypothesis based on an initial metric (low IPC) and then use the advanced capabilities of perf to prove or disprove it. A low IPC in a CPU-bound task strongly suggests the CPU is frequently stalled, unable to execute instructions.
Your Diagnostic Steps:
-
Formulate a Hypothesis: An IPC of 0.5 means the CPU is retiring one instruction every two clock cycles, on average. This indicates the CPU is spending about half its time stalled. The most common causes for stalls are waiting for data from memory (cache misses) or recovering from branch mispredictions. My primary hypothesis would be that the code has a poor memory access pattern leading to frequent cache misses.
-
Test the Hypothesis (Cache Misses):
- My first step is to profile specifically for cache misses. I would run:
perf record -e cache-misses -c 10000 -g -- ./my_app - I would then run
perf reporton the resultingperf.datafile. If my hypothesis is correct, the report will show a high concentration of samples in the specific functions or loops that are processing data. - Using the
annotatefeature withinperf report(by selecting a function and pressing 'a'), I can view the annotated source code and identify the exact lines of code responsible for the majority of cache misses. This is likely to be a memory access within a tight loop.
- My first step is to profile specifically for cache misses. I would run:
-
Test the Hypothesis (Branch Mispredictions):
- If the cache miss profile is inconclusive, my next step is to investigate branch mispredictions. I would run:
perf record -e branch-misses -c 10000 -g -- ./my_app - Again, I would use
perf reportandperf annotateto see if a particularifstatement or loop condition within the application is causing a large number of mispredictions. This often happens with data-dependent branches that have no predictable pattern.
- If the cache miss profile is inconclusive, my next step is to investigate branch mispredictions. I would run:
-
Synthesize and Conclude: By profiling for these specific hardware events, I can move beyond the generic "it's slow" to a precise diagnosis like "the application is slow because this specific loop is causing a high rate of L2 cache misses due to its strided memory access pattern." This provides a clear, actionable starting point for optimization.
Conclusion
In this lesson, you've been introduced to perf, the Linux kernel's premier performance analysis tool. You've seen that it's far more than just a top replacement; it's a sophisticated tool for deep microarchitectural analysis.
Key Takeaways:
perfoperates in two main modes:perf statfor high-level event counting andperf recordfor detailed profiling via sampling.- Profiling CPU usage is typically done with timed sampling (
-F), which helps identify which functions are on-CPU most often. - Profiling cache misses and branch mispredictions is done with event-based sampling (
-e), which pinpoints the exact code paths causing microarchitectural stalls. - Getting accurate and readable results requires compiling with debug symbols (
-g) and without omitted frame pointers (-fno-omit-frame-pointer). - Visualizations like Flame Graphs are invaluable for interpreting complex profiling data.
Preview of the Next Lesson:
While perf is excellent for sampling and finding "hot spots," it's not always the best tool for understanding the exact sequence, timing, and latency of events. In our next lesson, we will explore ftrace, the kernel's built-in tracer. You'll learn how to use ftrace and trace-cmd to trace specific kernel function calls, measure latencies, and understand the intricate interactions between different kernel subsystems.