Introduction
Welcome to the final lesson in our module on PCIe Subsystem Internals. Over the last few lessons, we've built a comprehensive understanding of the PCIe subsystem, from its layered architecture and enumeration process to memory mapping, interrupt handling, IOMMU security, and power management. We've seen how the kernel discovers, configures, and interacts with PCIe devices, assuming everything works as expected.
This lesson tackles the inevitable reality of system development: things often go wrong. When a PCIe device fails to initialize, it can be a daunting problem. Our goal today is to equip you with a systematic methodology to debug a PCIe device initialization failure using lspci, setpci, and kernel log analysis.
We'll build upon our use of lspci and setpci from the previous lesson on ASPM, expanding their application to general-purpose debugging. By the end of this lesson, you will be able to diagnose common failure modes, interpret critical error messages, and trace the problem back to its source, whether it's in hardware, the kernel, or a device driver.
1. The Core Debugging Toolkit
When a PCIe device isn't working, your first task is to gather evidence. Three fundamental tools provide the bulk of the information you'll need.
A. lspci: The Reconnaissance Tool
lspci is your first port of call to determine the status of the PCIe bus. It reads the device configuration space and presents it in a human-readable format.
lspci: Simply lists all detected PCI/PCIe devices with their vendor and device IDs. The first question it answers is: Is the device even visible on the bus?lspci -tv: Displays the devices in a tree view. This is crucial for understanding the topology—how devices are connected through root ports and switches.
lspci -v(or-vvvfor maximum verbosity): This is the most important command for debugging initialization. It decodes the configuration space, showing you what resources (memory regions, I/O ports, IRQs) have been assigned. Pay close attention to keywords like[unassigned]or[disabled], as they are clear indicators of an initialization failure.
B. Kernel Logs (dmesg): The Narrative
The kernel logs provide a chronological account of the boot process, including the entire PCIe enumeration sequence. You can access them using the dmesg command. These logs tell the story of what the kernel tried to do and where it encountered problems.
When debugging, you'll use grep to filter for relevant messages. Useful search terms include:
dmesg | grep -i pcidmesg | grep -i <driver_name>dmesg | grep <bdf>(e.g.,dmesg | grep 04:00.0)
C. setpci: The Surgical Instrument
While lspci reads and interprets the configuration space, setpci allows you to directly read from (and write to) specific registers. This is an advanced tool for when you need to verify a single field, like a bit in the Command register, without the verbosity of lspci.
For example, to read the Command register (offset 0x04) of device 04:00.0:setpci -s 04:00.0 COMMAND
You can also dump the raw hexadecimal data from the configuration space, which is useful for comparing a failing device to a working one.
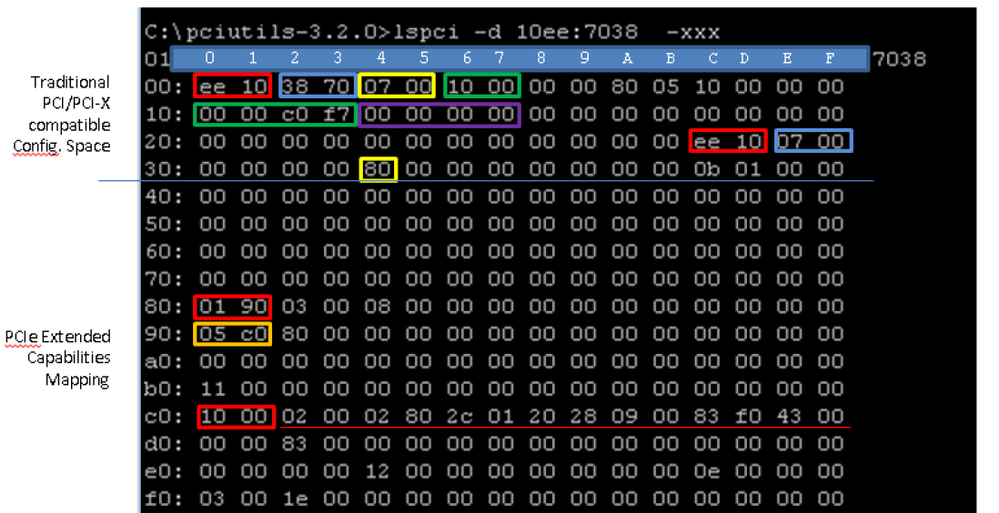
A word of caution: setpci can also write to registers. This is extremely powerful but dangerous. An incorrect write can crash your entire system. For debugging, you will almost always use it in read-only mode.
2. Scenario 1: Device Detected, Resources Unassigned
This is one of the most common and complex failure modes, especially in embedded systems with many devices competing for address space.
- Symptom: The device appears in
lspci, but when you inspect it withlspci -v, you see that its Base Address Registers (BARs) are marked as[unassigned]or[disabled]. The device is visible but unusable because the kernel failed to assign it the memory-mapped I/O (MMIO) windows it needs to function. - Underlying Cause: This is a failure during the resource allocation phase of PCIe enumeration. The kernel was unable to find a large enough contiguous block in the system's physical address map to satisfy the device's BAR requests.
Let's dive into a real-world example of an engineer debugging this exact problem on an ARMv8 embedded system.
PCIe BAR alignment issue under Linux
This Stack Overflow post, titled 'PCIe BAR alignment issue under Linux', is a masterclass in debugging a resource allocation failure. The author methodically uses our core toolkit to isolate a subtle issue in a vendor-specific driver.
Please read through the question and the accepted answer. As you read, focus on these points: Initial Diagnosis (Section 0): How does the author use lspci -tv and lspci -s <BDF> -v to identify and present the problem? Note the [unassigned] and [disabled] flags. Deep Dive & Comparison (Section 1 & 2): How does the author use kernel tracing (printk) and a QEMU virtual host to compare the failing call stack with a working one? Pay attention to the discovery that different kernel functions (pci_assign_unassigned_bus_resources vs. pci_bus_size_bridges) were being called. This comparison is the key to the diagnosis. Root Cause & Solution (Section 1): What was the final root cause? Understand why calling the wrong kernel function, which made an incorrect assumption about firmware's role, led to the resource allocation failure.
Analysis of the Case Study
This case study is a perfect illustration of a systematic debugging workflow:
- Observation: The engineer starts with
lspciand immediately spots the key symptom:Memory at <unassigned> ... [disabled]for the AMD GPU. This confirms the device is detected but not configured. - Hypothesis: The engineer suspects an alignment or fragmentation issue in the memory map, even showing a diagram of the memory layout.
- Verification: The real breakthrough comes from kernel tracing. By adding
printks and comparing the kernel call stack on the real hardware versus a working QEMU environment, a critical difference is found.- Failing System:
xilinx_pcie_probe->pci_assign_unassigned_bus_resources - Working System:
pci_host_probe->pci_bus_size_bridges
- Failing System:
- Root Cause Analysis: The engineer correctly deduces that
pci_assign_unassigned_bus_resourcesis meant for scenarios where firmware (like a PC BIOS) has already performed initial resource sizing. On this embedded system, U-Boot did nothing, and the kernel was responsible for everything. The Xilinx driver used the wrong function, leading to incorrect calculations and failure. - Solution: The fix was to replace the incorrect function call in the driver with the two calls used by the standard kernel host bridge driver:
pci_bus_size_bridges(bus);followed bypci_bus_assign_resources(bus);.
This scenario highlights an advanced debugging principle: compare against a known-good configuration. Even if the good configuration is a virtual one in QEMU, it can reveal critical deviations in the software path.
3. Scenario 2: Device Not Detected at All
What if the device doesn't even show up in lspci? This points to a much lower-level problem, happening before the kernel even gets a chance to read its Vendor ID.
- Symptom: The device is physically present in a slot, but it does not appear in the output of
lspci. - Underlying Cause: This is often a failure in the very first stage of the link bring-up process: Link Training. The physical layers of the two connected components (e.g., root port and endpoint) failed to establish a stable connection. This can be due to hardware issues (improper seating, power problems, signal integrity) or firmware configuration errors.
Diagnosing Link Training Failures
Since lspci is useless here, your primary tool becomes the kernel log.
PCIe - Qualcomm Linux Interfaces Guide
The Qualcomm Linux Interfaces Guide provides excellent examples of kernel logs during PCIe enumeration. We will look at a log snippet that shows exactly what to look for when a link fails to train.
First, read the section under 'Enable NVMe over PCIe', step 2 'Locate the PCIe logs'. Find the line qcom-pcie 1c00000.pci: Phy link never came up. This is the smoking gun for a link training failure. \nThen, to contrast, review the logs in the first section of the document ('PCIe kernel driver log') and the lspci outputs in the 'Debug PCIe issues' section to see what a successful enumeration looks like.
When you see a message like Phy link never came up in your dmesg output, it's a strong indicator of a physical layer problem. Your debugging process should pivot to:
- Hardware Checks: Is the card correctly and firmly seated in its slot? Does it have adequate power? On some development boards, PCIe slots can be disabled by jumpers or switches.
- Firmware/BIOS Settings: Check your BIOS or U-Boot settings. Some platforms require you to explicitly enable certain PCIe slots or configure their link speed (e.g., Gen3, Gen4). A mismatch in supported speeds can sometimes cause link training to fail.
- Signal Integrity: In a professional setting, this is where you would use an oscilloscope or a dedicated PCIe protocol analyzer to inspect the electrical signals on the bus. For a software-focused developer, recognizing the kernel log message is the key deliverable.
4. A Systematic Debugging Workflow
Let's consolidate these ideas into a step-by-step procedure for when you're told "the PCIe card isn't working."
-
Is the device visible?
- Run
lspci. - NO: The device is not detected. Go to step 2.
- YES: The device is detected. Go to step 3.
- Run
-
Diagnose Detection Failure:
- Check kernel logs:
dmesg | grep -i pci. - Look for low-level errors like
Phy link never came uporlink training failed. - If found, investigate physical causes: card seating, power, slot-enable jumpers, BIOS/firmware settings.
- Check kernel logs:
-
Diagnose Initialization Failure:
- Check topology:
lspci -tv. Is the device under the correct bridge? - Check resource allocation:
lspci -s <bdf> -vv. Look at the BARs. - Are they
[unassigned]or[disabled]? If so, you have a resource allocation problem. - Check kernel logs (
dmesg) for errors related to "resource allocation", "BAR", or memory conflicts. - Check the system memory map with
cat /proc/iomemto see if there's address space fragmentation that could prevent a large BAR from being allocated.
- Check topology:
-
Driver-Level Issues:
- If resources are assigned correctly but the device still doesn't work (e.g., no network interface appears for a NIC), the problem may be in the device driver.
- Check
dmesgfor messages from the specific driver. It may have failed to probe for other reasons (e.g., failed to load firmware, failed to map BARs, failed to request IRQ).lspci -kcan show you which driver is bound to the device.
5. Interview Scenario
Interviewer: "You've just plugged a new, custom FPGA card into your embedded Linux system. After booting, you find it's not functional. lspci shows the device, but its BARs are all listed as [unassigned]. What is your debugging process?"
Click for Analysis
This question targets your understanding of the "Device Detected, Resources Unassigned" scenario. A strong answer demonstrates a methodical approach.
Your Diagnostic Steps:
-
Confirm the Symptom: The first step is to confirm the initial report. I'd run
lspci -s <bdf> -vvon the FPGA's Bus:Device.Function address to personally inspect the BARs and confirm they are[unassigned]. I would also checkdmesgfor any explicit "failed to allocate resources" messages from the PCI subsystem. -
Analyze the Request: The size of the requested BARs is a critical clue. I'd use
setpcior the verboselspcioutput to determine the size of the memory regions the FPGA is requesting. A request for a very large, multi-gigabyte BAR is a common cause of allocation failure on memory-constrained embedded systems. -
Analyze the Memory Map: I would inspect the system's overall memory map by running
cat /proc/iomem. I'm looking for a large enough free window in the PCIe MMIO address space to fit the FPGA's requested BAR. It's possible the space is too fragmented by other devices that were enumerated earlier. -
Isolate the Cause:
- Device Fault? Is the FPGA programmed to request an unreasonably large BAR? I would consult the FPGA design specification.
- System Fault? Is the memory map on the embedded board too small or fragmented? I might need to adjust the device tree (
.dtsfile) to reserve a larger address window for the PCIe host bridge. - Kernel/Driver Fault? This is less likely for a standard resource allocation, but as we saw in the case study, a non-standard host bridge driver could have a bug. I would compare the enumeration log with that of a standard x86 PC to see if the process differs.
-
Propose a Solution: Based on the findings, I might propose reducing the BAR size in the FPGA firmware if it's unnecessarily large, or modifying the system's device tree to expand the available PCIe memory space if the request is legitimate.
This approach moves logically from symptom, to data gathering, to analysis, and finally to a concrete solution, showcasing a robust engineering mindset.
Conclusion
This lesson concludes our deep dive into the PCIe subsystem by tackling one of its most challenging aspects: debugging. You now have a structured workflow and are familiar with the key symptoms and kernel messages associated with common initialization failures.
Key Takeaways:
- Debugging PCIe failures is a process of elimination, starting with high-level tools and drilling down into logs and specific registers.
lspcitells you if a device is detected and how it's configured.dmesgtells you the story of the kernel's attempt to bring the device online.- A device not appearing in
lspcipoints to a low-level link training failure. - A device appearing with
[unassigned]resources points to a resource allocation failure.
With the ability to configure, manage, and now debug PCIe devices, you have a solid foundation in one of the most critical I/O subsystems in modern computing.
Preview of the Next Module:
In the next module, "System Performance & Scalability Analysis," we will shift our focus from getting things working to making them work fast. We will explore powerful tools like perf and ftrace to profile CPU usage, trace kernel behavior, and identify performance bottlenecks across the entire system, including the I/O paths we've just mastered.