Introduction
In our last lesson, we explored perf, a powerful sampling profiler excellent for identifying "hot spots"—the code paths where your system spends most of its CPU time. You learned to use it to analyze CPU usage, cache misses, and branch mispredictions, answering the question, "Why is the CPU busy?"
Now, we turn to a different but complementary tool: ftrace. While perf excels at statistical profiling, ftrace is a tracer. It's designed to record a sequence of events, providing a detailed, chronological log of what happened in the kernel. This allows us to answer questions like, "What was the exact sequence of function calls leading to this point?" and "How much time elapsed between event A and event B?" This is invaluable for debugging complex interactions and latency issues, which are common challenges in embedded systems.
Today's learning outcome is to use ftrace and trace-cmd to trace kernel function calls, latencies, and specific events across subsystems. We will start by understanding the ftrace framework itself and then master trace-cmd, its powerful command-line interface.
1. The Ftrace Framework
ftrace is built directly into the Linux kernel. It works by placing hooks at various points—such as function entry/exit points and statically defined tracepoints—to capture data as the kernel executes. This data is written into a per-CPU ring buffer in memory, which can then be read from user-space.
The primary way to interact with ftrace is through the tracefs pseudo-filesystem, typically mounted at /sys/kernel/tracing. While you can directly echo commands into files in this directory and cat the output, it's a cumbersome process. A much more effective approach is to use a user-space front-end.
2. Introducing trace-cmd
trace-cmd is the standard, feature-rich command-line utility for ftrace, created and maintained by Steven Rostedt, the author of ftrace itself. It simplifies tracing by providing a clear command structure and managing the tracefs interactions for you.
To understand the relationship between the low-level tracefs and the trace-cmd utility, please watch the following video from Steven Rostedt.
Steven Rostedt - Learning the Linux Kernel with tracing
In his talk 'Learning the Linux Kernel with tracing,' Steven Rostedt first demonstrates the manual, tracefs-based method of using ftrace and then introduces trace-cmd as the more powerful and user-friendly alternative.
Watch from 23:18 to 31:08. First (23:18 - 27:30), observe how you can manually enable a tracer by echoing its name into current_tracer and read the output from the trace file. This gives you a foundational understanding of the underlying mechanism. Then (27:30 - 31:08), see how trace-cmd abstracts this away with simple commands like trace-cmd start -p function and trace-cmd show.
The most common trace-cmd workflow involves three steps:
trace-cmd record <options>: Start tracing and record the data into atrace.datfile.trace-cmd report: Read thetrace.datfile and display the events in a human-readable format.trace-cmd reset: Stop tracing and clear allftraceconfigurations, returning the system to a clean state.
3. Tracing Events with Tracepoints
One of the most powerful features of ftrace is its ability to trace tracepoints. These are static, stable hooks placed at logical points in the kernel code by developers. They allow you to observe high-level events like scheduler decisions, system call entry/exit, block I/O requests, and more.
Exploring and Enabling Events
You can see all available events on your system with:
trace-cmd list -e
This will produce a long list, organized by subsystem (e.g., sched, syscalls, irq, kmem).
Let's trace a specific, critical event: sched_switch. This event fires every time the kernel performs a context switch. This is fundamental to understanding which processes are running and when.
Linux in-kernel Tracer: ftrace | DEEP LINUX
The video 'Linux in-kernel Tracer: ftrace' provides a very clear, step-by-step tutorial on how to enable and view specific trace events using the tracefs interface. The concepts translate directly to trace-cmd.
Please watch the following two segments: 33:29 - 36:35: See how to enable just the sched_switch event. While the video uses manual echo commands, the equivalent in trace-cmd is trace-cmd record -e sched_switch. 12:15 - 17:05: Pay close attention to the explanation of the trace output format. Understand what each column means: the task name and PID, the CPU, the timestamp, and the event-specific payload.
Now, let's do it with trace-cmd. Run this command for a few seconds and then hit Ctrl+C:
sudo trace-cmd record -e sched_switch
Then, view the report:
trace-cmd report
You will see output like this:
# tracer: nop
#
#                              _-----=> irqs-off
#                             / _----=> need-resched
#                            | / _---=> hardirq/softirq
#                            || / _--=> preempt-depth
#                            ||| /
#            TASK-PID   CPU# ||||    TIMESTAMP  FUNCTION
#               | |      |   ||||       |         |
          swapper/0-0     [000] ..... 12345.678901: sched_switch: prev_comm=swapper/0 prev_pid=0 prev_prio=120 prev_state=R ==> next_comm=my-app next_pid=5432 next_prio=120
           my-app-5432    [000] ..... 12345.679123: sched_switch: prev_comm=my-app prev_pid=5432 prev_prio=120 prev_state=S ==> next_comm=kworker/0:1 next_pid=12 next_prio=120
This output tells you precisely when and where my-app was switched out in favor of a kernel worker thread. By analyzing the timestamps, you can calculate exact residency times.
4. Tracing Function Calls and Latency
Beyond static tracepoints, ftrace can dynamically trace almost any function in the kernel. This is incredibly useful for understanding code flow and measuring execution latency. There are two main tracers for this:
function: Traces the entry of kernel functions.function_graph: Traces both the entry and exit of functions, calculating their duration and displaying them in a nested C-like format. This is extremely useful for latency analysis.
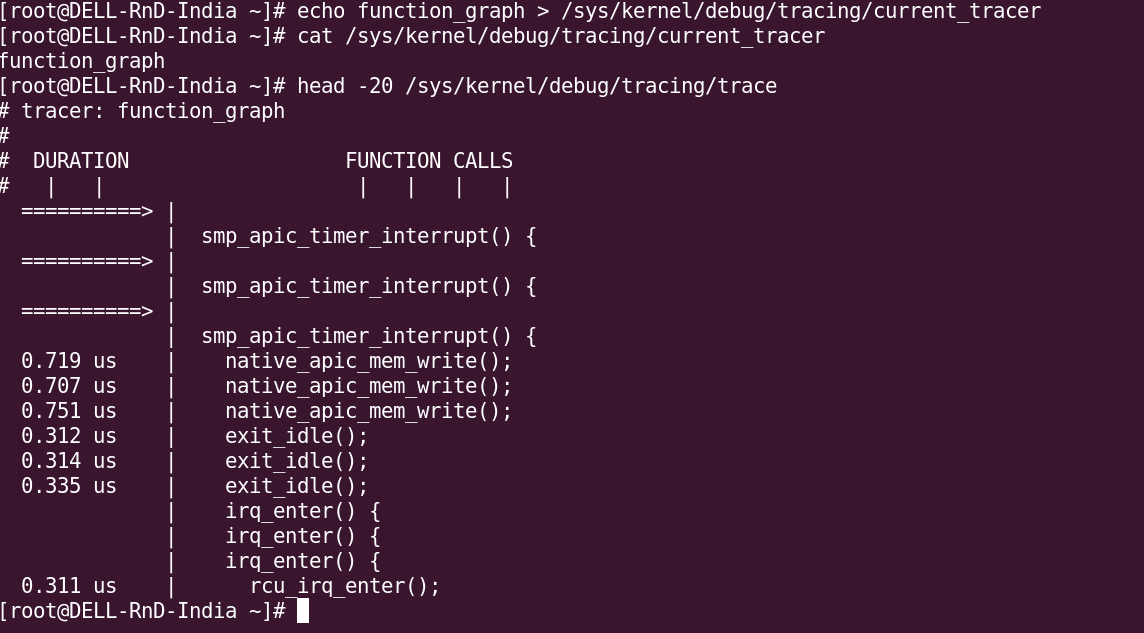
Let's follow an expert as he uses the function graph tracer to understand what really happens inside a simple sys_write system call.
Steven Rostedt - Learning the Linux Kernel with tracing
In this segment of his talk, Steven Rostedt uses the function_graph tracer to dissect the execution of a hello world program. This is a masterclass in using ftrace to explore kernel internals.
Watch from 31:08 to 40:00. Pay close attention to the methodology: He starts by tracing the hello program and sees page faults and system calls. He notices all syscalls go through a generic entry point (do_syscall_64). He increases the graph depth (--max-graph-depth 2) to find the specific function for the write syscall (__x64_sys_write). He then filters the trace to graph only that function (-g __x64_sys_write), giving him a clear view of its internal call tree. He demonstrates how to remove noise by filtering out functions he doesn't care about (-n RW_verify_area).
This example shows a powerful workflow: start with a broad trace, identify key functions, and then iteratively narrow your focus using filters to get a clear picture of the specific code path you are interested in.
5. trace-cmd Cookbook: Practical Recipes
Your experience as a developer means you'll quickly appreciate having a "cookbook" of common commands. Here are some of the most useful trace-cmd patterns for real-world analysis.
Introduction to kernel tracing using trace-cmd - devkernel.io
The article 'Introduction to kernel tracing using trace-cmd' provides an excellent set of practical examples for common tracing scenarios. We will use it as a reference for this section.
This is a reference reading. Skim through the examples for tracing individual functions, multiple functions, a single process, and getting a call stack. We will be applying these commands directly.
-
Trace a specific function:
Use the-l(or--func-filter) option. This is much more efficient than tracing all functions.# Trace every time vfs_read is called sudo trace-cmd record -p function -l vfs_read -
Trace a specific process:
Use the-Poption to trace kernel activity performed on behalf of a specific user-space process.# Trace all kernel functions called while 'ls -R /' runs sudo trace-cmd record -p function -P "ls -R /" -
Trace an event with a filter:
Use the-eoption for the event and-ffor the filter. This is crucial for reducing trace volume. You can find filterable fields in the/sys/kernel/tracing/events/<subsystem>/<event>/formatfile.# Trace scheduler wakeups, but only for the process with PID 1234 sudo trace-cmd record -e sched_wakeup -f "pid == 1234" -
Get a stack trace for an event:
Sometimes you want to know who triggered an event. Use--event-stack.# When kmalloc is called, show the kernel stack trace sudo trace-cmd record -e kmem:kmalloc --event-stack
6. Interview Scenario
Interviewer: "We're seeing intermittent high latency in our embedded device's main control loop. When the latency spike occurs, the task is delayed by over 500 microseconds. perf shows that the CPU is mostly idle during this time, so it's not a CPU-bound problem. How would you use ftrace to diagnose the root cause of this preemption or scheduling delay?"
Click for Analysis
This is a classic embedded systems problem. The key information is that the CPU is idle, which rules out a simple "hot loop" and points towards a scheduling or interrupt-related issue. The task is being kept off the CPU for some reason. ftrace is the perfect tool for this.
Your Diagnostic Steps:
-
Formulate a Hypothesis: The latency is likely caused by one of three things:
- The task is being preempted by a higher-priority task.
- The task is being blocked waiting for a lock held by another task (possibly on another CPU).
- Interrupts are disabled for a long period, preventing the scheduler from running.
-
Step 1: Capture a wide-angle view with the
wakeuptracer. Thewakeupandwakeup_rttracers are specifically designed to measure scheduling latency. I would start here.sudo trace-cmd record -p wakeup -P <my_app_pid>After capturing a latency spike,
trace-cmd reportwould show the time from when the task was woken up to when it actually began executing on a CPU. It also shows which task was running on the target CPU in the intervening time, which could immediately identify the preempting task. -
Step 2: Trace scheduler and interrupt events. If the
wakeuptracer isn't enough, I'd trace a combination of events to build a complete picture of the scheduling environment around the time of the spike.sudo trace-cmd record -e sched_switch -e sched_wakeup -e irq_handler_entry -e irq_handler_exit -asched_switch: Shows exactly which tasks are running on all CPUs.sched_wakeup: Shows when my task becomes runnable.irq_handler_*: Shows if a long-running interrupt handler is monopolizing the CPU.
-
Step 3: Use the
irqsofftracer. A more direct way to test the "interrupts disabled" hypothesis is with theirqsofftracer. It tracks the time periods where interrupts are disabled.sudo trace-cmd record -p irqsoffA report from this trace will pinpoint any functions that are disabling interrupts for an unacceptably long time, which would directly cause scheduling delays.
-
Synthesize and Conclude: By combining these traces, I can create a precise timeline. For example, "At timestamp X, my task was woken up by an interrupt. However, it did not run until timestamp Y. The trace shows that between X and Y, CPU 0 was executing the
other_task, which has a higher priority. This confirms a priority-based preemption issue." This detailed, evidence-based analysis is exactly whatftraceis designed to provide.
Conclusion
You've now added ftrace and trace-cmd to your performance analysis toolkit. You've seen how it complements perf by providing detailed, chronological traces of kernel activity, which are essential for diagnosing latency and complex system interactions.
Key Takeaways:
ftraceis a kernel framework for tracing events and functions, accessed via thetracefsfilesystem.trace-cmdis the preferred user-space tool for controllingftrace.- Event tracing (
-e) uses statictracepointsto monitor logical kernel events like context switches (sched_switch). - Function tracing (
-p function) can dynamically trace kernel function calls. - The
function_graphtracer (-p function_graph) is the most powerful tool for latency analysis, showing call graphs with execution times. - Effective tracing relies on filtering (
-l,-f,-P) to isolate the relevant information and reduce noise.
Preview of the Next Lesson:
ftrace and perf are powerful, but they have their limitations. ftrace can generate huge amounts of data, and its analysis is mostly done post-mortem in user-space. perf is statistical. What if we could combine the event-based nature of tracing with in-kernel programmability to perform analysis at the source? That's exactly what eBPF enables. In our next lesson, you'll describe the eBPF architecture and its advantages over traditional kernel tracing methods, opening the door to even more powerful and efficient system analysis.