Introduction
Welcome to the final lesson in our module on system performance and scalability. In our previous lesson, we transformed a standard Linux kernel into a real-time system using the PREEMPT_RT patch and learned to measure its worst-case latency with cyclictest. We saw that even with a real-time kernel, background system activity can introduce unwanted jitter.
This raises a crucial question for any embedded systems engineer: what do you do when the latency is still too high? This lesson provides the answer. Today, you will learn to tune kernel parameters via sysctl and manage task affinity to optimize specific workload scenarios.
We will move from simply measuring performance to actively improving it. You will learn how to create a "sanctuary" for your critical tasks, shielding them from interference from other processes and even hardware interrupts. This is a vital skill for meeting strict deadlines in automotive, aerospace, or industrial control systems and a key topic in senior-level embedded interviews.
1. Fine-Tuning the Kernel with sysctl
The Linux kernel is not a black box; it exposes hundreds of tunable parameters that allow you to adapt its behavior to specific needs. The primary tool for this is sysctl, which provides a user-space interface to the kernel's configuration settings exposed in the /proc/sys virtual filesystem.
Let's start by understanding how to use this powerful tool.
Managing Kernel Parameters with Sysctl
This video, 'Managing Kernel Parameters with Sysctl', provides a clear and concise introduction. It explains the relationship between sysctl and the /proc/sys filesystem and demonstrates how to read, temporarily modify, and persistently set kernel parameters.
Watch the entire video (about 11 minutes). It covers all the essential mechanics: Understanding /proc/sys: How kernel parameters are represented as files. Reading parameters: Using both cat /proc/sys/... and sysctl <variable>. Temporary changes: Using echo into a /proc file or, more cleanly, with sysctl -w <variable>=<value>. Persistent changes: The correct way to make changes survive a reboot by adding configuration files to /etc/sysctl.d/ and applying them with sysctl -p.
Key sysctl Concepts
- File-based Interface: Each tunable is a file under
/proc/sys/. For example, the file/proc/sys/net/core/somaxconncorresponds to thesysctlvariablenet.core.somaxconn. Slashes in the file path become dots in the variable name. - Temporary vs. Persistent: Changes made with
sysctl -ware lost on reboot. To make them permanent, you must add them to a.conffile in/etc/sysctl.d/. The system automatically applies these files on boot.
Common Parameters for Performance Tuning
While there are countless tunables, a few are particularly relevant for optimizing workloads, especially network-intensive ones.
Linux Network Performance Ultimate Guide
The 'Linux Network Performance Ultimate Guide' provides an excellent overview of the packet processing path and highlights key sysctl parameters that you can tune at various stages. We'll focus on a few critical ones.
Please read the following sections to understand what these parameters control: 'Interrupt Coalescing (soft IRQ)': Focus on net.core.netdev_budget and net.core.netdev_budget_usecs. These control the trade-off between network throughput and CPU time available for other tasks. 'Ingress QDisc': Read about net.core.netdev_max_backlog. This is a crucial parameter to increase if you are dropping packets because they arrive faster than the kernel can process them. 'TCP Read and Write Buffers/Queues': Understand net.ipv4.tcp_rmem and net.ipv4.tcp_wmem. These control the default and maximum TCP socket buffer sizes, which directly impact network throughput over high-latency links.
Tuning these parameters allows you to, for example, increase buffer sizes to handle high-volume traffic or adjust processing budgets to favor either raw throughput or responsiveness for other applications on the system.
2. Controlling Placement: Task and Interrupt Affinity
In a multi-core system, the scheduler's default goal is to balance the load evenly. However, for real-time or performance-critical applications, this can be detrimental due to cache misses and NUMA effects. CPU affinity is the mechanism we use to override this default behavior and "pin" a process to one or more specific CPU cores.
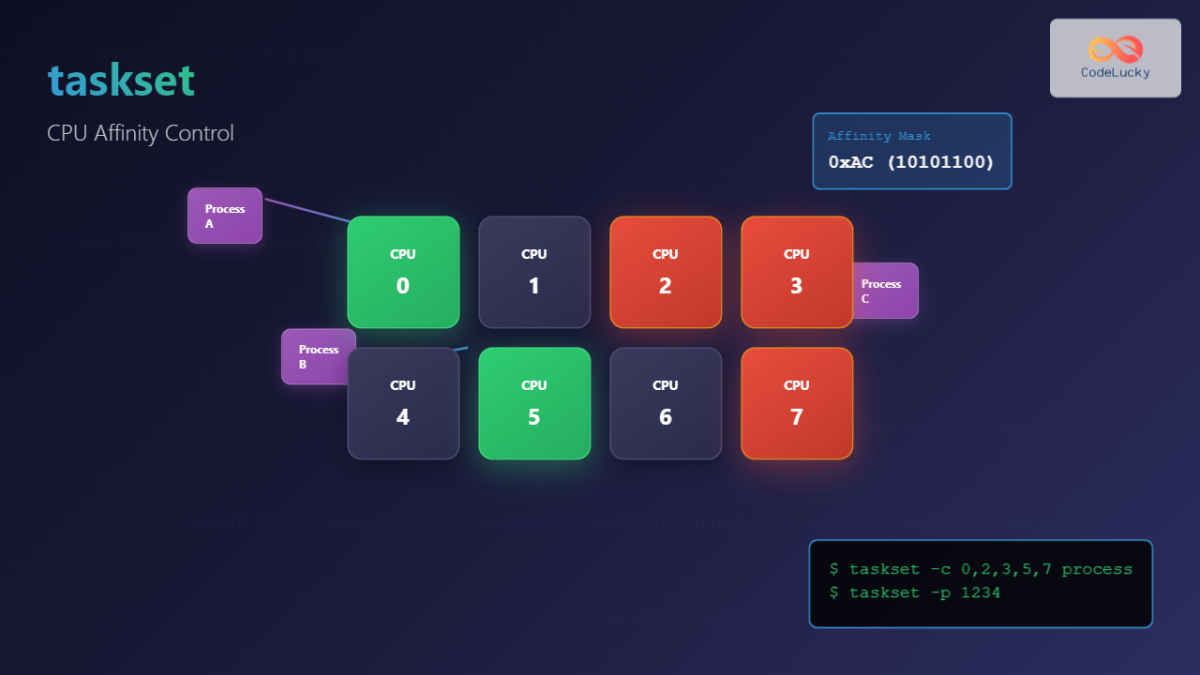
The primary command-line tool for managing CPU affinity is taskset.

Why is Affinity Critical for Optimization?
- Cache Performance: When a process runs on a CPU, its data and instructions are loaded into that core's L1 and L2 caches. If the scheduler moves the process to another core, those caches become useless, and the data must be slowly fetched from main memory again. Pinning a process to a core maximizes cache hits.
- Real-Time Isolation: This is the most important reason in your field. We can designate one or more cores as "sanctuary" cores for our real-time tasks. By moving all other non-critical processes and interrupts away, we minimize the chances of our critical task being preempted, drastically reducing latency.
Linux OS Runtime Optimizations — ECI documentation
The 'Linux OS Runtime Optimizations' guide from Intel provides practical examples of using affinity to achieve real-time performance.
Read the section titled 'Eliminate Sources of CPU Contention'. Pay close attention to the use of the taskset command to assign the affinity of a workload to a specific CPU. Note the distinction between setting affinity for a parent process and its children.
Interrupt (IRQ) Affinity: The Silent Performance Killer
Pinning your process is only half the battle. If a hardware interrupt (e.g., from a network card, disk controller, or even a timer) is handled by your sanctuary core, it will preempt your critical task, causing a latency spike. IRQ affinity allows us to control which CPUs can handle which hardware interrupts.
You can control this by writing a CPU bitmask to the /proc/irq/<IRQ_NUM>/smp_affinity file for a given interrupt number.
Let's see how this is applied in a common scenario: network interrupt handling.
Linux OS Runtime Optimizations — ECI documentation
Let's return to the Intel optimization guide to see how they manage network IRQs.
Read the section 'Network Interrupts Affinity to CPU'. You'll see how to: Identify which interrupts belong to which devices using cat /proc/interrupts. Observe the default behavior where all interrupts are often handled by CPU 0. Use scripts or manual echo commands to change the affinity, spreading the load across other cores and away from critical ones.
By methodically moving non-essential interrupts away from your real-time core, you eliminate a major source of unpredictable latency.
3. Advanced Scenario: Packet Steering in High-Speed Networking
Let's dive into a more advanced and practical application that combines these concepts: optimizing a multi-core system for high-speed network traffic. When a single CPU can't keep up with the rate of incoming packets, the kernel provides several mechanisms to distribute the load. These are excellent examples of performance tuning.
Network Performance in the Linux Kernel, Getting the most out of the Hardware
This deep-dive video, 'Network Performance in the Linux Kernel', explains the techniques used to scale network processing across multiple cores. This is directly relevant to your experience with complex systems and is a fantastic topic for high-level interviews.
Watch the following segments, focusing on the differences between each technique: Receive Packet Steering (RPS) (18:52 - 21:13): A pure software mechanism to spread packet processing to other CPUs after the initial interrupt. Receive Side Scaling (RSS) (21:13 - 25:41): A hardware feature where the NIC distributes packets across multiple queues, each tied to a different CPU via IRQ affinity. This is more efficient than RPS. Receive Flow Steering (RFS) (25:41 - 31:03): A software enhancement that steers packets to the CPU where the application consuming the data is running, improving cache locality. Transmit Packet Steering (XPS) (36:47 - 38:38): The transmit-side equivalent, allowing you to map transmit queues to specific CPUs. \nNotice how these are all configured by writing to files in sysfs (e.g., /sys/class/net/.../rps_cpus), which is conceptually similar to how sysctl manages /proc/sys.
Understanding these mechanisms demonstrates a deep knowledge of how the kernel's networking stack interacts with modern multi-core hardware—a hallmark of a senior developer.
4. Tying It All Together: A Workload Optimization Scenario
Let's walk through a typical optimization problem.
Scenario: You are working on an automotive data logger with a 4-core ARM processor running a PREEMPT_RT kernel.
- CPU0, CPU1: General purpose housekeeping cores.
- CPU2: Dedicated to a high-priority task that processes sensor data from a CAN bus interface. This task must run every 1ms with a maximum latency of 50µs.
- CPU3: Dedicated to a data-logging task that writes sensor data to an NVMe drive.
Initial tests with cyclictest on CPU2 show occasional latency spikes up to 150µs, failing the requirement.
Your Optimization Strategy:
-
Isolate the Real-Time Core: First, isolate CPU2 from the general scheduler. You can do this with the kernel boot parameter
isolcpus=2. This tells the kernel not to schedule any regular tasks on CPU2 unless they are explicitly assigned to it. -
Analyze and Move Interrupts:
- Run
watch -n1 cat /proc/interruptsand observe the system under load. - You notice that interrupts for the NVMe drive (used by CPU3) and a system timer are frequently firing on all CPUs, including CPU2.
- Find the IRQ numbers for the NVMe controller and the timer.
- Change their affinity to only run on the housekeeping cores (CPU0 and CPU1). The CPU mask for cores 0 and 1 is
3(binary0011).# Example for moving NVMe IRQ 45 echo 3 > /proc/irq/45/smp_affinity - Find the IRQ for the CAN bus interface and pin it exclusively to CPU2. The mask for CPU2 is
4(binary0100).# Example for pinning CAN IRQ 42 echo 4 > /proc/irq/42/smp_affinity
- Run
-
Pin Critical Processes:
- Launch your sensor processing task explicitly on CPU2:
taskset -c 2 ./sensor_processor - Launch your logging task explicitly on CPU3:
taskset -c 3 ./data_logger
- Launch your sensor processing task explicitly on CPU2:
-
Verify the Fix: Re-run
cyclicteston CPU2 with the system under full load. The maximum latency should now be well below the 50µs threshold, as CPU2 is now shielded from both process and interrupt interference.
5. Interview Scenario
Interviewer: "You're debugging a high-frequency trading application running on a multi-core server with a PREEMPT_RT kernel. The core trading logic, which is pinned to a specific CPU, is experiencing rare but costly latency spikes. You've already confirmed its process priority is set to SCHED_FIFO 99. What are the top three sources of interference you would investigate, and what specific command-line tools would you use to diagnose and fix them?"
Click for Analysis
A strong answer will demonstrate a systematic, tool-driven approach to isolating sources of preemption.
Your Analysis:
"My primary assumption is that something is preempting my high-priority task, despite its real-time priority. My investigation would focus on three main suspects:
-
Suspect 1: Interrupt Interference. A non-critical hardware interrupt is still being handled by the dedicated real-time core.
- Diagnosis: I would use
watch -n1 cat /proc/interrupts. By observing the interrupt counts per CPU over time, I can identify which IRQs are firing on my dedicated core. I would look for interrupts related to networking, storage, or timers. - Fix: Once I identify the offending IRQ number (e.g., IRQ 75), I would change its affinity to a different, non-critical 'housekeeping' core using a command like
echo <new_mask> > /proc/irq/75/smp_affinity. This change would be scripted to persist across reboots.
- Diagnosis: I would use
-
Suspect 2: Competing Kernel Threads or Processes. Another task, possibly a kernel worker or a misconfigured user-space process, is running on the dedicated core.
- Diagnosis: I would use
top -Hand then press1to get a per-CPU, per-thread view. I would filter the view to my dedicated core and look for any process other than my critical task (and expected kernel threads likeksoftirqdif interrupts are pinned there).htopis also excellent for this as it can visually filter by CPU. - Fix: If I find a stray process, I would use
taskset -p <cpu_mask> <pid>to move it to a different core immediately. For a permanent solution, I would ensure the system is booted with theisolcpuskernel parameter to prevent the scheduler from placing any general tasks on my dedicated core in the first place.
- Diagnosis: I would use
-
Suspect 3: SoftIRQ Processing. Even if the hard IRQ is on another core, the deferred work (softIRQ), like network packet processing via NAPI, could be scheduled on my dedicated core.
- Diagnosis: I would use
cat /proc/net/softnet_statto check for packet processing statistics. More directly, I would use tracing tools likeftraceorperf traceto capture events on the dedicated core during a latency spike. I would trace scheduling events (sched_switch) and softirq entry/exit events to see exactly what is running when my task should be.
- Fix: This is more complex. If it's network-related, I would use RPS/RFS/XPS settings (via
sysfs) to control which CPUs handle which packet flows, steering them away from my critical core. For example, by modifying/sys/class/net/eth0/queues/rx-0/rps_cpus, I can dictate which CPUs are allowed to process packets from that receive queue."
- Diagnosis: I would use
Conclusion
In this lesson, you have acquired a powerful set of tools and techniques for optimizing kernel and application performance. You have learned that achieving deterministic behavior goes beyond simply enabling PREEMPT_RT; it requires a deliberate and systematic approach to managing system resources.
Key Takeaways:
sysctlis the key to kernel tunables. It allows you to modify hundreds of kernel parameters affecting networking, scheduling, and memory management, both temporarily and persistently.- Task affinity is essential for isolation. Using
taskset, you can pin critical processes to dedicated cores to maximize cache performance and prevent interference from other processes. - IRQ affinity is non-negotiable for low latency. You must actively manage which CPUs handle hardware interrupts by manipulating
/proc/irq/.../smp_affinityto protect your real-time cores. - Optimization is a holistic process. It involves understanding the workload, identifying bottlenecks with tools, and applying a combination of kernel tuning, affinity settings, and sometimes even boot parameters (
isolcpus) to create a stable, predictable system.
Preview of the Next Module:
We have now completed our deep dive into performance analysis and tuning. We've profiled, traced, enabled real-time capabilities, and optimized for specific workloads. Our next module, "Advanced Kernel Debugging & Tracing," shifts focus from performance to correctness. In the first lesson, "Use dynamic debug and printk log levels effectively to trace issues across kernel subsystems," we will start with the most fundamental debugging technique: getting the right information out of the kernel when things go wrong.