Introduction
Welcome to the module on Advanced Kernel Debugging & Tracing. In the previous module, we focused on performance—profiling, tracing, and optimizing a running system to meet strict requirements. We learned how to keep a healthy system running at its peak. Now, we shift our focus to what happens when the system is "sick." How do you find the root cause of a bug, a crash, or unexpected behavior deep within the kernel?
This lesson is your first step into that world. It covers the most fundamental of all debugging techniques: logging. You will learn to use printk log levels and the dynamic debug (dyndbg) framework effectively to trace issues across kernel subsystems. While simple in concept, mastering kernel logging is the difference between a quick diagnosis and days of frustrating trial-and-error. These skills are your first line of defense when investigating any kernel-level issue, from a misbehaving driver in an automotive ECU to a subtle race condition in QEMU.
1. The Foundation of Kernel Logging: printk and Log Levels
The most basic tool for getting information out of the kernel is printk. It works much like printf in user space, but its output is directed to the kernel's log buffer.
However, filling your driver with simple printk calls can create a "firehose" of information, making it impossible to find what you need. This is why the kernel provides log levels: a way to assign a severity or priority to each message.
Let's code a Linux Driver: 6- printk log levels
To understand the mechanics and importance of log levels, let's watch this practical tutorial from the 'Johannes 4GNU_Linux' channel. It clearly explains why using log levels is a fundamental best practice in kernel development.
Watch these three short segments: Introduction (00:00 - 00:44): The presenter explains why proper log levels are a basic but critical part of writing readable and maintainable kernel code. Available Log Levels (02:25 - 03:57): This section details the eight log levels, from KERN_EMERG (most severe) to KERN_DEBUG (least severe), and shows the syntax for using them. Why Use Log Levels? (03:49 - 05:11): Here, the benefits are summarized: improved code clarity and, most importantly, the ability to filter messages based on severity.
As the video explained, the log levels are:
| Constant | Priority | Description |
|---|---|---|
KERN_EMERG |
0 | System is unusable (emergency) |
KERN_ALERT |
1 | Action must be taken immediately |
KERN_CRIT |
2 | Critical conditions |
KERN_ERR |
3 | Error conditions |
KERN_WARNING |
4 | Warning conditions |
KERN_NOTICE |
5 | Normal but significant condition |
KERN_INFO |
6 | Informational messages |
KERN_DEBUG |
7 | Debug-level messages |
Here is a typical usage pattern in a kernel module:
#include <linux/init.h>
#include <linux/module.h>
#include <linux/kernel.h>

static int __init my_module_init(void)
{
    pr_info("Module loaded successfully.\n"); // pr_info is a wrapper for printk(KERN_INFO ...)
    // ... initialization code ...
    if (some_error_condition) {
        pr_err("Failed to initialize hardware component X.\n");
        return -EIO;
    }
    pr_debug("Hardware component X initialized in debug mode.\n");
    return 0;
}

static void __exit my_module_exit(void)
{
    pr_info("Module unloaded.\n");
}

module_init(my_module_init);
module_exit(my_module_exit);
How Logs Flow Through the System
Messages sent via printk don't just disappear. They are written to a circular buffer in kernel memory. User-space tools and daemons then read from this buffer to display the messages or write them to persistent files.
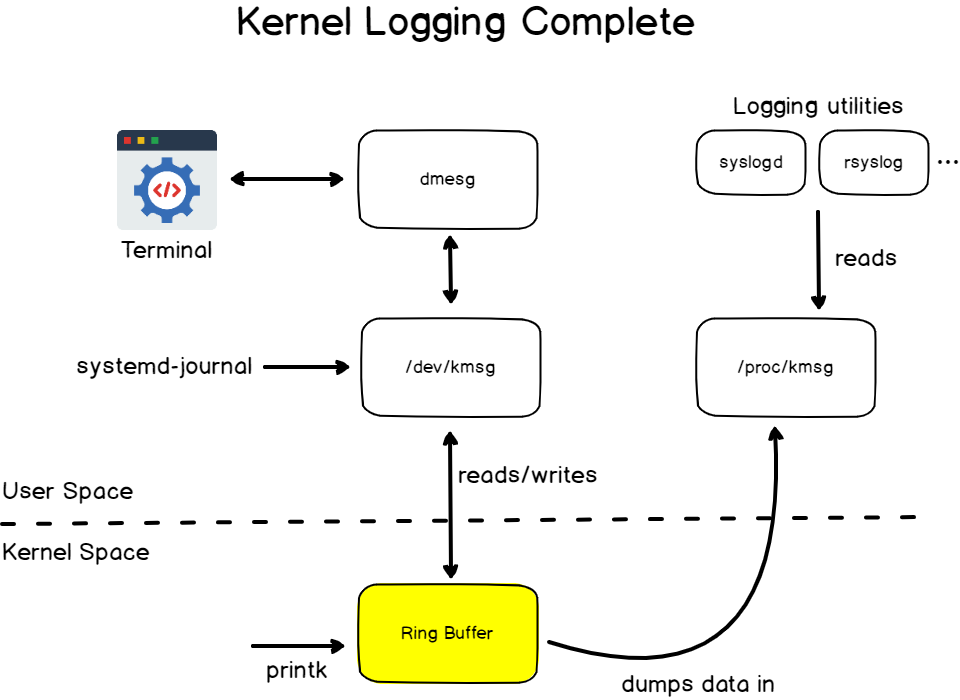
You can control which messages are printed directly to the system console by adjusting the console_loglevel. This is done by writing to /proc/sys/kernel/printk. This file contains four values, but the first one is the most important: the current console log level. Only messages with a priority lower than this value will be printed to the console.
For example, to see only messages of KERN_WARNING or higher severity (priority 4 or less):
# A priority of 4 means messages with level 0, 1, 2, 3 will be printed.
echo "4" > /proc/sys/kernel/printk
To see all messages, including KERN_DEBUG:
echo "8" > /proc/sys/kernel/printk
2. Going Deeper: Strategic printk for Tracing
While log levels help filter output, sometimes you just need to quickly understand the flow of execution in a complex function without setting up a full debugger. This is where "shotgun debugging" with printk comes in.
Mentorship Session: Linux Kernel Debugging Tricks of the Trade
In this 'Mentorship Session' from The Linux Foundation, kernel developer Joel Fernandes demonstrates a practical, low-effort technique to trace code paths. This is a trick of the trade that you'll find immediately useful.
Watch the segment on 'Shotgun Debugging' (50:11 - 53:06). Joel shows how you can sprinkle identical printk calls throughout a function, using the __FILE__ and __LINE__ macros to create a simple, effective execution trace.
The core idea is to use a macro that automatically includes location information:
#define TRACE_POINT() printk(KERN_DEBUG "TRACE: %s:%d\n", __func__, __LINE__)

void complex_function(struct my_device *dev)
{
    TRACE_POINT(); // Placed at the start of the function

    if (dev->status == STATUS_A) {
        // ... some logic ...
        TRACE_POINT();
    } else {
        // ... other logic ...
        TRACE_POINT();
        if (dev->needs_reset) {
            TRACE_POINT();
            reset_device(dev);
        }
    }

    TRACE_POINT(); // Placed at the end
}
By loading your module and examining the dmesg output, you can instantly see the exact path taken through complex_function without having to write unique messages for each point.
For even more context, especially when trying to understand how you got to a certain point, you can dump the current stack trace using dump_stack():
if (unlikely(error_condition)) {
    pr_warn("Unexpected error condition detected!\n");
    dump_stack();
}
This will print the full call chain to the kernel log, which is invaluable for diagnosing bugs that depend on a specific calling sequence.
3. The Modern Approach: Dynamic Debug (dyndbg)
Using printk and pr_debug is effective, but it has a major drawback: to add or remove a debug message, you must recompile the kernel or module. This is slow and inefficient.
The dynamic debug framework solves this. It allows you to enable or disable individual pr_debug() call sites at runtime, without recompilation.
Enabling Dynamic Debug
First, the kernel must be compiled with CONFIG_DYNAMIC_DEBUG enabled.

Using the dyndbg Control Interface
Once enabled, dyndbg is controlled by writing commands to a special file, typically /sys/kernel/debug/dynamic_debug/control.
Let's explore the documentation to understand the command syntax.
Dynamic debug - The Linux Kernel documentation
The official kernel documentation on Dynamic Debug is the most authoritative resource. We'll read through the key parts that explain how it works.
Please read the following sections: Introduction: This confirms if dyndbg is available and introduces its purpose. Viewing Dynamic Debug Behaviour: Explains how to cat the control file to see all available pr_debug sites and their current status (=p means printing is enabled). Controlling dynamic debug Behaviour: Shows the basic echo command structure. Command Language Reference: This is the most important section. Study it carefully. Focus on: Match Specifications: func, file, module, format, and line. Flags Specification: The + (add), - (remove), and = (set) operations, and the p (print) flag.
Practical dyndbg Examples
The command syntax is [match-spec...] [flags-spec]. Let's see it in action.
-
To enable all
pr_debugcalls in a specific driver file:echo "file my_driver.c +p" > /sys/kernel/debug/dynamic_debug/control -
To enable all
pr_debugcalls within a specific function:echo "func my_ioctl +p" > /sys/kernel/debug/dynamic_debug/control -
To disable messages on a specific line:
echo "file my_driver.c line 123 -p" > /sys/kernel/debug/dynamic_debug/control -
To enable messages containing a specific string:
echo 'format "DMA transfer complete" +p' > /sys/kernel/debug/dynamic_debug/control -
Combining filters (AND logic): enable a message on a specific line in a specific file:
echo "file my_driver.c line 250 +p" > /sys/kernel/debug/dynamic_debug/control -
Add function and line number information to the output:
echo "file my_driver.c +flp" > /sys/kernel/debug/dynamic_debug/controlThe output will now be prefixed with the function name and line number, similar to our
TRACE_POINTmacro, but without modifying the source code!
Debugging During Boot
What if the problem occurs during boot, before the debugfs filesystem is mounted? You can use the dyndbg kernel boot parameter.
Dynamic debug - The Linux Kernel documentation
Let's revisit the documentation to learn about this powerful feature.
Read the section 'Debug messages during Boot Process'. It explains how to pass a query via the dyndbg="QUERY" boot argument to enable tracing from very early in the boot sequence.
For example, to debug the e1000e network driver during initialization, you could add this to your bootloader configuration:dyndbg="module e1000e +p"
4. Interview Scenario
Interviewer: "We have a custom embedded board where a complex PCIe device intermittently fails to initialize during boot. We suspect a race condition in our driver's probe function. The boot log is already flooded with other messages, and because the failure is rare, we can't afford the long recompilation cycles needed to add and remove printk statements. How would you approach debugging this efficiently?"
Click for Analysis
Your Analysis:
"This is a perfect use case for the kernel's dynamic debug framework, as it's designed to solve exactly this problem: targeted logging, at boot time, without recompilation. My approach would be:
-
Preparation: First, I'd ensure the kernel is compiled with
CONFIG_DYNAMIC_DEBUG=y. I would replace any temporaryprintkstatements in our driver withpr_debug(), which is the standard practice for conditional debug messages. -
Targeted Boot-Time Tracing: Since the issue occurs during boot before
debugfsis available, I would use thedyndbgkernel command-line parameter. This allows me to activate specificpr_debugsites as the kernel is starting up. -
Initial Broad Query: My first attempt would be to enable all debug messages within our driver module to capture the entire probe sequence. I'd add the following to the boot arguments:
dyndbg="module our_pcie_driver +p"
This will show the general flow within our driver without cluttering the log with messages from other subsystems. -
Surgical Refinement: If that's still too much information, I would narrow the focus. By studying the source code of our probe function, I can identify the critical sections. Let's say the core logic is between lines 300 and 450. I can create a much more precise query to only trace that specific area and include function and line number information for context:
dyndbg="file drivers/pci/our_pcie_driver.c line 300-450 +flp"
The+flpflags are key here:ffor function name,lfor line number, andpto enable printing.
This method is highly efficient. It allows me to change the debugging scope with a simple reboot instead of a full recompile, and it keeps the boot log clean by only printing the exact information I need to diagnose the race condition."
Conclusion
In this lesson, you've moved from basic logging to a sophisticated, targeted tracing methodology. You now have a clear framework for instrumenting kernel code to find the root cause of problems.
Key Takeaways:
- Always use log levels with
printk. This is the most basic form of filtering and is essential for code clarity and log management. pr_debug()is your default for debugging. It compiles down to nothing unlessDEBUGis defined, and more importantly, it creates hooks for thedyndbgframework.- Master the
dyndbgcommand language. This is your power tool. It lets you surgically enable and disable tracing at runtime, filtering by file, function, module, line, or even message content. - Use the
dyndbgboot parameter for early-stage debugging. This is a critical technique for investigating issues in initialization code that runs before user space is fully available.
Preview of the Next Lesson:
We've learned how to get information out of a running kernel. But what if you need to stop the kernel in its tracks and inspect its state interactively? In the next lesson, "Configure a target environment and use KGDB/KDB to set breakpoints and inspect a live kernel," we will do just that. You'll learn how to set up a kernel debugger, halt execution, examine memory and variables, and step through code, giving you an unparalleled level of insight into the kernel's live operation.