Introduction
In our previous lesson, we mastered the art of passive observation. We learned to use printk log levels and the dynamic debug framework to coax information out of a running kernel, allowing us to trace execution paths without halting the system. This is a powerful first line of defense for debugging.
However, some bugs are too complex for logging alone. To solve them, you need to stop time. You need to pause the entire kernel, peer inside its live state, examine memory, and walk through the code step-by-step. This lesson provides you with that power. You will learn to configure a target environment and use KGDB/KDB to set breakpoints and inspect a live kernel.
KGDB (Kernel GNU Debugger) and KDB (Kernel DeBugger) are the standard tools for interactive kernel debugging. Think of KGDB as a GDB "server" built into the kernel, allowing the powerful GDB client on your development machine to connect and take control. KDB, on the other hand, is a simpler, self-contained debugger shell that runs directly on the target's console. We'll learn how to use both.

1. Understanding KGDB and KDB
Before we configure anything, it's crucial to understand what these tools are and how they relate to each other. KGDB provides the back-end for source-level debugging with GDB, while KDB offers a more direct, command-line interface for quick analysis.
Using Serial kdb / kgdb to Debug the Linux Kernel - Douglas Anderson, Google
To start, let's watch this segment from a talk by Google engineer Douglas Anderson. He provides a clear and concise explanation of what KDB and KGDB are, their respective roles, and how they are now integrated into a single framework.
Watch the clip from 03:21 to 06:33. Focus on the distinction he makes: KDB: A simple, text-based shell for getting diagnostic information (like dmesg or process lists) directly from a stopped kernel. KGDB: The GDB server protocol implementation. It doesn't do much on its own but provides the binary interface for GDB to connect and perform powerful source-level debugging.
In essence, you get the best of both worlds. You can use KDB for a quick look at the system state, and then seamlessly switch to KGDB for a full-powered GDB session when you need to dig deeper.
2. Configuring the Target Environment
Setting up for kernel debugging is the most critical and detailed part of the process. It involves two main steps: building a kernel with the correct features enabled and configuring the system to make the debugger available.
The standard setup requires two machines:
- Target: The machine (physical or virtual) running the custom-built, debug-enabled kernel.
- Host: Your development machine, where you run the GDB client.
The connection is typically made over a serial port, which can be a physical port or a virtual one provided by a hypervisor like QEMU.
2.1. Kernel Build Configuration
You must compile your kernel from source with specific options enabled. These options instrument the kernel and include the necessary debugging symbols and infrastructure.
Using kgdb, kdb and the kernel debugger internals
The official kernel documentation provides the definitive list of configuration options. Let's review the essential ones.
Read the section 'Compiling a kernel', focusing on the subsections for 'Kernel config options for kgdb' and 'Kernel config options for kdb'. This will give you the authoritative source for the options we're about to discuss.
Here is a checklist of the essential kernel configurations you'll need. You can find these options in your kernel's .config file or via make menuconfig under "Kernel hacking".
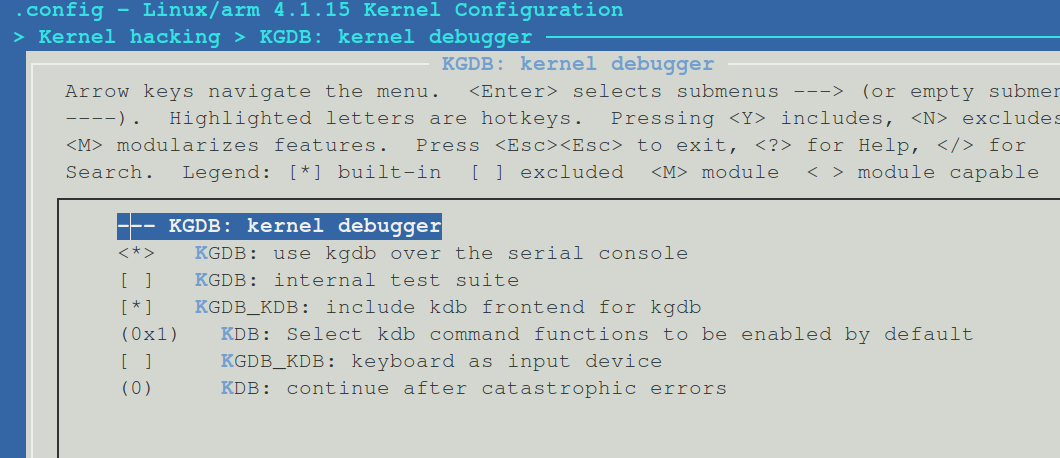
Essential Configuration Checklist:
CONFIG_KGDB=y: Enables the core kernel debugger infrastructure.CONFIG_KGDB_SERIAL_CONSOLE=y: Enables the driver to use a serial port for debugging. This is the most common I/O mechanism.CONFIG_KGDB_KDB=y: Includes the KDB shell front-end. This allows you to use both KDB and KGDB.CONFIG_DEBUG_INFO=y: Crucial. This tells GCC to include DWARF debugging symbols in thevmlinuxfile, which GDB needs for source-level debugging.CONFIG_FRAME_POINTER=y: Helps GDB produce more reliable stack backtraces.CONFIG_MAGIC_SYSRQ=y: Enables the Magic System Request key, which is the primary way to manually enter the debugger on a running system.
Important Considerations for Debugging:
- Disable Kernel Address Space Layout Randomization (KASLR): KASLR moves the kernel's location in memory on every boot, which confuses GDB. You can disable it with
CONFIG_RANDOMIZE_BASE=nor, more flexibly, by adding thenokaslrparameter to the kernel's boot command line. - Disable Watchdogs: When the kernel is stopped in the debugger, it cannot service watchdog timers. This will cause the system to reboot unexpectedly. Disable any hardware or software watchdogs (
CONFIG_WATCHDOG=nand check your bootloader settings). - Disable Read-Only Protections: For GDB to insert software breakpoints, it needs to write to the kernel's code section. Features like
CONFIG_STRICT_KERNEL_RWXprevent this. It's often easiest to disable this during a debug session.
2.2. Hardware Setup and Boot Arguments
With your custom kernel compiled, you need to boot it on the target and tell it how to communicate with the debugger.
Using Serial kdb / kgdb to Debug the Linux Kernel - Douglas Anderson, Google
Let's return to Douglas Anderson's talk. He gives an excellent, practical walkthrough of the entire setup process, including handling a common issue: sharing a single serial port between the console and the debugger.
Watch the segment from 12:24 to 20:09. Pay close attention to: The requirement for a serial driver with polling mode support. His explanation of kdmx, a tool that multiplexes a single serial line into two virtual ports: one for the console and one for GDB. This is a common and highly useful technique. The need for a cross-compiled GDB on your host machine. The kernel boot arguments kgdboc and panic, which configure the debugger's I/O channel.
The two most important boot arguments are:
kgdboc=<device>,[baud]: This tells the "KGDB over console" driver which serial device to use and at what speed. For example:kgdboc=ttyS0,115200.kgdbwait: This forces the kernel to stop early in the boot process and wait for a GDB client to connect. This is essential for debugging issues that happen during startup, such as in driver probe functions.
A typical debug-ready kernel command line in your bootloader might look like this:console=ttyS0,115200 kgdboc=ttyS0,115200 kgdbwait nokaslr
3. Using the Kernel Debugger
With the environment configured, you are ready to stop the kernel and inspect it.
3.1. Entering the Debugger and Using KDB
The most common way to manually break into the debugger on a running system is with a Magic SysRq command.
- From a shell on the target machine, run:
echo g > /proc/sysrq-trigger - The kernel will halt, and you will see a
kdb>prompt on your serial console.
Now you are in the KDB shell. It's a simple but effective tool for a first look.
Using Serial kdb / kgdb to Debug the Linux Kernel - Douglas Anderson, Google
This clip demonstrates entering the debugger and using some of KDB's most common commands.
Watch from 20:09 to 26:58. The presenter shows how to drop into the debugger with SysRq and demonstrates commands like help, dmesg, bt (backtrace), and the very useful dump all, which provides backtraces for all active tasks.
Here are some of the most useful KDB commands:
help: Lists all available commands.ps: Shows the process list.dmesg: Dumps the kernel log buffer.bt: Prints a backtrace of the currently executing task.btc: (On multi-core systems) Prints a backtrace for the task running on each CPU.go: Resumes kernel execution.kgdb: Switches from the KDB shell to KGDB mode, preparing to accept a GDB connection.
3.2. Source-Level Debugging with KGDB and GDB
Now for the main event: connecting GDB for full source-level debugging.
The Workflow:
- Stop the kernel: Enter the debugger via SysRq, a panic, or
kgdbwait. If you're in the KDB shell, you can optionally typekgdbto explicitly enter KGDB mode. - Launch GDB on the host: You must use a GDB built for your target's architecture (e.g.,
aarch64-linux-gnu-gdb) and point it to thevmlinuxfile that contains the debug symbols.# On your host machine aarch64-linux-gnu-gdb /path/to/your/kernel/source/vmlinux - Connect to the target: Use the
target remotecommand, pointing to the serial port device on your host that is connected to the target.# Inside GDB (gdb) set remotebaud 115200 (gdb) target remote /dev/ttyUSB0
You are now connected! GDB will show you the exact line of C code where the kernel is stopped.
Using Serial kdb / kgdb to Debug the Linux Kernel - Douglas Anderson, Google
The following video segment is a masterclass in using GDB to debug the kernel. It covers everything from connecting and setting breakpoints to inspecting memory and registers.
Watch carefully from 26:58 to 40:48. This is the practical core of the lesson. You will see demonstrations of: Switching to KGDB mode and connecting the GDB client. Using bt (backtrace) to see the call stack. Using disassemble to view the underlying assembly code. Using info reg and p $x6 (on ARM64) to inspect CPU registers. Navigating stack frames (up, frame 1) and listing source code (list). Printing the values of C variables and even performing calculations within GDB.
3.3. Advanced Inspection: Debugging Other Tasks
When you first connect, you are debugging the task that was running on the CPU that entered the debugger. But what if the problem lies in another process or even on another CPU? KGDB represents all kernel tasks (processes/threads) and CPUs as GDB "threads".
You can use standard GDB thread commands to investigate the entire system.
Using Serial kdb / kgdb to Debug the Linux Kernel - Douglas Anderson, Google
This final video demonstration shows a more advanced scenario: diagnosing a soft lockup. This requires finding the misbehaving task, which may not be the one you initially break into.
Watch from 51:38 to 01:01:44. The key techniques to note are: Using the KDB command btc to get a backtrace of all CPUs to identify the one that is stuck. Using info threads in GDB to list all kernel tasks. Using the thread <id> command in GDB to switch context and debug a different task or CPU.
This is an incredibly powerful technique that allows you to move around a completely frozen system and inspect the state of any task you wish.
A Note on Modern Front-Ends
While powerful, the GDB command line can feel archaic. Modern IDEs like Visual Studio Code can act as a graphical front-end for GDB, providing a much more intuitive experience with clickable breakpoints, variable watch windows, and call stack navigation.
Debugging the Linux kernel with GDB
For a more visual approach, this video shows how to configure VS Code to act as a graphical front-end for a KGDB session.
Watch the segment from 27:28 to 35:50. It demonstrates creating a launch.json file to automate the GDB connection, allowing you to debug the kernel with the same modern interface you might use for application development.
4. Interview Scenario
Interviewer: "A kernel panic is occurring intermittently on one of our embedded devices during the initialization of a specific network driver. We have serial console access. A simple printk in the driver's probe function isn't enough to pinpoint the issue. Describe, step-by-step, how you would use a kernel debugger to find the root cause of this panic, assuming it happens after the kernel has started booting but before you can log in."
Click for Analysis
Your Analysis:
"This is a classic scenario for kgdbwait. Since the panic happens during boot, I need to stop the kernel before the faulty driver code runs. Here is my step-by-step plan:
-
Configure the Kernel: First, I would ensure the kernel is built with all the necessary debugging options:
CONFIG_KGDB,CONFIG_KGDB_SERIAL_CONSOLE,CONFIG_DEBUG_INFO, andCONFIG_MAGIC_SYSRQ. I would also disable KASLR (nokaslrboot arg), watchdogs, andCONFIG_STRICT_KERNEL_RWXto ensure the debugger can operate correctly. -
Modify Boot Arguments: I would modify the kernel command line in the bootloader. I'd add two key parameters:
kgdboc=ttyS0,115200(adjusting the device name and baud rate as needed for the target board).kgdbwait. This is the most critical part. It will cause the kernel to pause execution early in the boot sequence and wait for a GDB connection.
-
Reboot and Connect: I'd reboot the target device. On the serial console, I would see a message indicating it's waiting for a KGDB connection. On my host machine, I would then:
- Launch the cross-compiled GDB with the
vmlinuxfile containing symbols:aarch64-linux-gnu-gdb ./vmlinux. - Connect to the target:
target remote /dev/ttyUSB0.
- Launch the cross-compiled GDB with the
-
Set Breakpoint and Investigate: Once connected, the kernel is under my control. My first action would be to set a breakpoint at the entry point of the problematic driver's probe function.
(gdb) b my_network_driver_probe -
Run to Breakpoint: I would then tell the kernel to continue execution until it hits my breakpoint.
(gdb) cThe kernel will now boot normally until it starts to load my driver, at which point execution will halt inside the
probefunction. -
Step-by-Step Analysis: From here, I am in the ideal position to find the bug. I can step through the probe function line-by-line using
nextandstep, inspecting the state of local variables, device registers (by printing memory-mapped pointers), and data structures with theprintcommand. By carefully observing the state as I execute the code, I can identify exactly where the logic goes wrong, leading to the panic."
Conclusion
You have now learned one of the most powerful techniques in the kernel developer's arsenal. While logging provides the breadcrumbs, interactive debugging with KGDB and GDB lets you become a detective, freezing the scene of the crime and examining every piece of evidence.
Key Takeaways:
- Configuration is Key: A successful debugging session depends on a correctly configured environment, including the right kernel
CONFIGoptions and boot arguments (kgdboc,kgdbwait,nokaslr). - KDB is for Quick Triage: Use the KDB shell for a fast, initial assessment of the system state with commands like
bt,ps, anddmesg. - KGDB/GDB is for Deep Analysis: For true source-level debugging, connect a GDB client to the KGDB stub. This allows you to set breakpoints, step through code, and inspect variables and memory as you would in an application.
- The Workflow: The standard process is to stop the kernel (via
kgdbwaitor SysRq), connect GDB to thevmlinuxfile, set a breakpoint in the area of interest, and then step through the code to find the fault.
Preview of the Next Lesson:
Debugging a live kernel is powerful, but you can't always keep a production system halted. Often, a system will crash and reboot immediately. In the next lesson, "Configure the kdump service to capture a kernel crash dump upon a panic," we will learn how to set up a system to automatically save the entire state of main memory when a crash occurs. This allows us to perform a post-mortem analysis, applying many of the same debugging skills to a crash dump file long after the event.