Introduction
In our last lesson, we delved into the eBPF architecture, understanding it as a safe, high-performance virtual machine within the kernel. We established that its core advantage is the ability to perform in-kernel data processing, avoiding the massive overhead of sending raw event streams to user space. This is a powerful concept, but writing raw eBPF bytecode or even restricted C is complex and not ideal for rapid, day-to-day analysis.
This is where high-level frontends come in. They provide powerful, expressive languages and tools that abstract away the complexities of eBPF compilation and loading, letting you focus on the question you want to answer.
In this lesson, you will learn to write bpftrace one-liners and use BCC tools to trace kernel behavior and analyze system performance. We will explore two of the most popular and powerful eBPF frontends:
- bpftrace: A high-level tracing language for ad-hoc analysis and custom scripts.
- BCC (BPF Compiler Collection): A toolkit of ready-to-use performance tools for common diagnostic scenarios.
By the end of this lesson, you'll be able to use these tools to investigate a wide range of system performance issues.
1. Getting Started: Installing the Tools
Before we begin, you need to install the necessary tools. The installation process varies slightly by Linux distribution. Since you are building a deep understanding of the kernel, it is highly recommended to work on a modern Linux distribution (like Ubuntu 20.04+, Fedora 33+, or Debian 11+) either on a bare-metal machine or in a VM. These newer versions have better out-of-the-box support for eBPF.
The following resource provides installation instructions for both bpftrace and bcc.
How to Trace System Calls and Functions with eBPF (bpftrace, bcc)
The article 'How to Trace System Calls and Functions with eBPF' provides clear, step-by-step installation instructions for both bpftrace and the BCC tool suite across major Linux distributions.
Please follow the instructions in the 'Prerequisites and Installation' section to install both bpftrace and the BCC tools (bpfcc-tools or bcc-tools). Once installed, run the verification commands provided at the end of the section (sudo bpftrace -V and ls /usr/share/bcc/tools/) to ensure everything is set up correctly.
2. bpftrace: The Swiss Army Knife for Ad-Hoc Tracing
bpftrace is a high-level tracing language that allows you to write powerful tracing scripts, often as a single line of code (a "one-liner"). It uses a syntax inspired by awk and DTrace, making it incredibly expressive for on-the-fly system exploration.
The basic structure of a bpftrace program is:
probe_specifier /filter/ { action }
- Probe Specifier: Defines where to instrument (e.g., a kernel function, a tracepoint).
- Filter: An optional condition to decide when to run the action.
- Action: The code to execute what to do when the probe fires and the filter passes.
Let's walk through building your first bpftrace commands.
A Gentle Introduction to BPF using bpftrace
The video 'A Gentle Introduction to BPF using bpftrace' by Michael Mullin is an excellent, practical starting point. It guides you from finding available tracepoints to writing your first functional one-liners.
Watch from 03:05 to 13:24. Follow along on your own system if possible. (03:05 - 05:47) Focus on how to discover available tracepoints by exploring the /sys/kernel/debug/tracing/events directory. This is a fundamental skill for knowing what you can trace. (05:47 - 09:51) Pay close attention to the construction of your first one-liner. Note the use of the tracepoint probe, the printf action, and the built-in variables pid and comm. (09:51 - 13:24) This part is crucial. It shows how to access event-specific arguments (like args->filename) and the necessity of using the str() helper function to read strings from kernel memory.
Key bpftrace One-Liner Patterns
The video gave you a solid foundation. Now let's explore some of the most common and powerful patterns you'll use for performance analysis, which directly leverage the in-kernel aggregation capabilities we discussed in the last lesson.
The following one-liners are from Brendan Gregg's excellent bpftrace tutorial. Try running them on your system to see them in action.
-
Counting Events by Group:
This is one of the most fundamental patterns. Let's count how many system calls each process is making.# Count syscalls by process name. Press Ctrl-C to see the summary. sudo bpftrace -e 'tracepoint:raw_syscalls:sys_enter { @[comm] = count(); }'Here,
@[comm] = count();is the core.@[]defines a map. We are creating a map where the key is the process name (comm) and the value is an automatically incrementing counter. All this counting happens efficiently inside the kernel. -
Creating a Latency Histogram:
Let's measure the size of data returned byread()system calls and display it as a histogram.# Show a distribution of read() return sizes for a specific PID (replace 1234 with a PID on your system). # You can find PIDs using 'ps aux'. sudo bpftrace -e 'tracepoint:syscalls:sys_exit_read /pid == 1234/ { @bytes = hist(args->ret); }'The
hist()function collects the values (in this case, the return valueargs->retfrom the read syscall) and automatically generates a power-of-2 logarithmic histogram. This is perfect for understanding the distribution of latencies or sizes. -
Timing Function Execution:
This is the practical implementation of the interview scenario from our previous lesson. We use two probes: one at the function entry (kprobe) to record a start time, and one at the function return (kretprobe) to calculate the duration.# Time the duration of vfs_read() calls and show a histogram by process name. sudo bpftrace -e 'kprobe:vfs_read { @start[tid] = nsecs; } kretprobe:vfs_read /@start[tid]/ { @ns[comm] = hist(nsecs - @start[tid]); delete(@start[tid]); }'Let's break this down:
kprobe:vfs_read { @start[tid] = nsecs; }: When enteringvfs_read, we store the current timestamp (nsecs) in a map named@start, keyed by the thread ID (tid).kretprobe:vfs_read /@start[tid]/: When returning fromvfs_read, we first use a filter (/@start[tid]/) to ensure we only proceed if we have a saved start time for this thread.{ @ns[comm] = hist(nsecs - @start[tid]); delete(@start[tid]); }: We calculate the latency, add it to a histogram map named@ns(keyed by process name), and thendeletethe entry from our@startmap to clean up.
These patterns—counting, histograms, and timing—are the building blocks for countless performance investigations. For more complex logic, you can save your bpftrace code into a file (e.g., myscript.bt) and run it with sudo bpftrace myscript.bt.
3. BCC Tools: A Curated Toolbox for Common Problems
While bpftrace is excellent for custom queries, you often don't need to write a script from scratch. The BCC (BPF Compiler Collection) provides a rich set of powerful, ready-to-use tools for common performance analysis tasks. These are typically Python scripts that have the eBPF C code embedded within them.
For your goal of cracking interviews and becoming a proficient kernel developer, knowing which BCC tool to reach for is a critical skill.
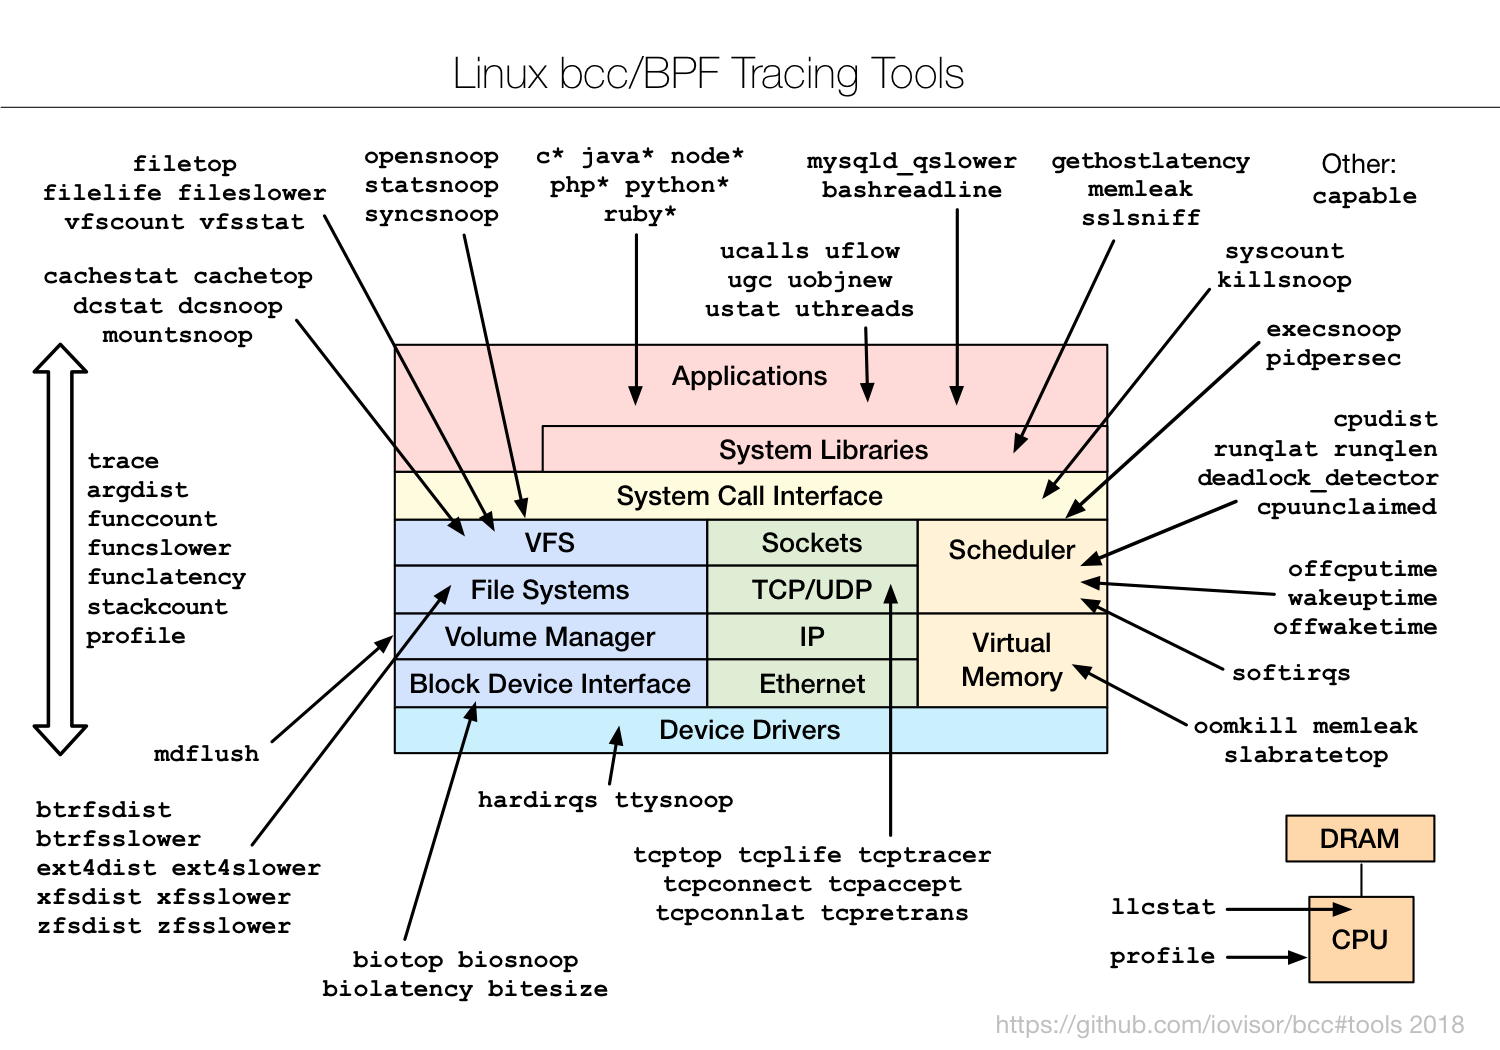
Let's see some of these tools in action.
Linux 4.x Tracing: Performance Analysis with bcc/BPF (eBPF)
In this segment from his talk 'Linux 4.x Tracing: Performance Analysis with bcc/BPF', Brendan Gregg provides a rapid-fire demonstration of several essential BCC tools. This will give you a feel for their power and ease of use.
Watch from 09:27 to 16:30. Observe how each tool is used to quickly diagnose a specific type of behavior: execsnoop: See new processes being created in real-time. opensnoop: Watch file open calls across the entire system. biolatency: Instantly get a histogram of disk I/O latency. biosnoop: See the details of individual disk I/O operations. ext4slower: Isolate slow operations specifically within the ext4 filesystem layer. \nNotice how these tools provide immediate, actionable insights with a single command.
Quick Reference for Essential BCC Tools
Here is a summary of the tools demonstrated, along with a few others you should be aware of. Most are installed in /usr/share/bcc/tools.
| Tool Name | Purpose | Example Usage (run with sudo) |
|---|---|---|
execsnoop |
Trace new process creation (execve() syscall). |
execsnoop -T (with timestamps) |
opensnoop |
Trace file opens (open()/openat() syscalls). |
opensnoop -p 1234 (for a specific PID) |
biolatency |
Summarize block I/O latency as a histogram. | biolatency -mD (in milliseconds, per-disk) |
biosnoop |
Trace block I/O with details (process, latency, size). | biosnoop -Q (include queueing time) |
fileslower |
Trace synchronous file reads/writes slower than a threshold. | fileslower 10 (trace ops slower than 10ms) |
tcplife |
Trace the lifespan of TCP sessions with stats. | tcplife -p 80 (trace port 80 traffic) |
funccount |
Count kernel or user function calls. | funccount 'vfs_*' (count VFS functions) |
profile |
A CPU profiler that samples stack traces at a timed interval. | profile -K -f 5 (profile kernel stacks for 5s) |
This is just a small sample. Exploring the /usr/share/bcc/tools directory on your system is a great way to discover the full range of available tools.
4. Interview Scenario: Diagnosing Application Sluggishness
Interviewer: "A database server is reporting periodic slowdowns. Users complain that some queries take much longer than expected. We suspect I/O issues, but iostat shows that the average disk utilization isn't abnormally high. How would you use eBPF-based tools to pinpoint the root cause?"
Click for Analysis
This is a classic performance analysis question. A great answer involves a methodical, top-down approach, starting with broad tools and progressively narrowing the focus. It demonstrates not just knowledge of the tools, but a sound diagnostic methodology.
Your Diagnostic Steps:
-
Characterize the Latency: The
iostataverage is misleading; it can hide latency outliers. My first step is to see the full distribution of disk I/O latency. I'd use a BCC tool for this.- Tool:
biolatency - Command:
sudo biolatency-bpfcc -mD - Reasoning: This will immediately tell me if we are experiencing a "bimodal" or "long-tail" latency problem, where most I/Os are fast but a few are extremely slow. The
-m(milliseconds) and-D(per-disk) flags provide human-readable output specific to each storage device.
- Tool:
-
Identify the Source of Slow I/O: If
biolatencyconfirms there are slow I/Os, the next question is who is causing them.- Tool:
biosnoop - Command:
sudo biosnoop-bpfcc -d /dev/sda(or the specific device) - Reasoning: This tool traces individual block I/O operations and shows the process name (
comm), PID, I/O type (Read/Write), size, and latency. By watching this output, I can directly correlate slow I/O events with the database process (e.g.,mysqld,postgres).
- Tool:
-
Move Up the Stack to the Filesystem: Block I/O is low-level. The problem might be higher up, in the filesystem layer (e.g., due to journaling or metadata operations).
- Tool:
ext4slower(assuming an ext4 filesystem) orfileslower. - Command:
sudo ext4slower-bpfcc 1 - Reasoning: This traces filesystem-level operations (read, write, open, fsync) that take longer than a given threshold (1 ms in this case). This is more accurate for measuring application-experienced latency than
biosnoop, as it includes time spent waiting on filesystem locks or other kernel processing.
- Tool:
-
Ad-Hoc Kernel Tracing with
bpftrace: If the pre-built tools point to a specific area but I need more detail, I'd turn tobpftrace. For example, if I suspect latency within the TCP stack when the database communicates with a client:- Tool:
bpftrace - Command:
sudo bpftrace -e 'kprobe:tcp_sendmsg { @start[tid] = nsecs; } kretprobe:tcp_sendmsg /@start[tid]/ { @us = hist((nsecs - @start[tid]) / 1000); delete(@start[tid]); }' - Reasoning: This custom one-liner precisely measures the latency of the
tcp_sendmsgkernel function, giving me a microsecond-level histogram. This allows for deep, targeted investigation when standard tools aren't enough.
- Tool:
Conclusion for the Interviewer:
"By starting broad with biolatency to confirm the problem, narrowing down the source with biosnoop and ext4slower, and then using bpftrace for deep-dive analysis if needed, I can efficiently diagnose the root cause of the I/O-related slowdowns without relying on potentially misleading averages from older tools."
Conclusion
In this lesson, you have moved from the theory of eBPF to its practical application. You've learned how to wield both bpftrace and the BCC tool collection to gain deep visibility into kernel and application behavior.
Key Takeaways:
bpftraceis a high-level language for writing custom, ad-hoc tracing one-liners and scripts. It's your tool for exploration and asking novel questions of the system.- BCC is a collection of pre-built, expert-written tools that solve common performance problems. They are your first stop for diagnosing issues related to processes, files, disk I/O, networking, and more.
- The fundamental patterns of counting, creating histograms, and timing events are the building blocks of performance analysis with eBPF.
- A methodical diagnostic approach—starting broad and narrowing down—is key to efficiently solving complex performance problems with these tools.
Preview of the Next Lesson:
Now that you're equipped with a powerful set of tracing tools, we'll focus on a specific and notoriously difficult performance challenge: lock contention. In the next lesson, you will learn to use profiling tools to identify a lock contention bottleneck and apply an appropriate resolution strategy. We'll see how the tracing skills you've developed today are essential for understanding and resolving these concurrency issues.