Introduction
In our last lesson, we learned how to use ftrace and trace-cmd to observe the scheduler's core activities: the sched_switch and sched_wakeup events. This gave us the foundational skill of seeing what the scheduler is doing.
Today, we take the critical next step: learning to diagnose why it's behaving in a way that causes problems. This lesson directly addresses the learning outcome: to diagnose a scenario-based scheduling problem, such as priority inversion or CPU starvation, and propose a solution. We will apply the tracing skills you've just acquired to dissect complex, real-world scenarios. Mastering this diagnostic process is a hallmark of a senior kernel developer and a frequent topic in high-level technical interviews.
We'll start by defining these common scheduling maladies and then dive into a detailed case study of a subtle priority inversion bug, learning an iterative debugging workflow. Finally, we'll explore advanced ftrace techniques for quantifying CPU starvation and scheduling latency.
1. Common Scheduling Problems: Starvation and Priority Inversion
Before we can diagnose these issues, we need to understand precisely what they are.
[PDF] (Advanced) Linux Kernel Programming - Lecture 07: CPU ...
These lecture slides from a course on advanced kernel programming clearly define the key problems associated with priority-based scheduling.
Please review slide 10, titled 'Priority Scheduling and Its Problems'. This slide gives concise definitions for CPU starvation and priority inversion.
From the reading, let's summarize:
- CPU Starvation: A runnable task is perpetually denied CPU time because higher-priority tasks are always available to run. While CFS is designed to prevent this for normal tasks, it can still occur in misconfigured real-time scenarios or under extreme load.
- Priority Inversion: This is a more complex and infamous problem. It occurs when a high-priority task becomes blocked, waiting for a resource (e.g., a mutex) held by a low-priority task. The situation becomes an "inversion" when a medium-priority task preempts the low-priority task, preventing it from releasing the resource and thereby indirectly blocking the high-priority task indefinitely. The Mars Pathfinder mission in 1997 famously suffered from this bug.
The classic solution to unbounded priority inversion is priority inheritance. Let's see how it works.
This short animation clearly illustrates how priority inheritance resolves a priority inversion scenario.
Watch the entire video. It visually demonstrates how the low-priority task's priority is temporarily boosted to that of the waiting high-priority task, allowing it to run, release the mutex, and resolve the deadlock.
In the Linux kernel, standard mutexes (mutex_lock) implement this priority inheritance protocol to prevent such deadlocks. However, as we're about to see, not all locking mechanisms do, especially in user space, and the interactions can be subtle.
2. Case Study: Debugging Scheduling Blockages in the Wild
Theory is one thing, but finding these problems in a complex system is another. We'll now walk through a real-world case study from Google engineers who diagnosed a UI stutter in Android caused by a priority inversion-like scenario.
This case study is a masterclass in iterative debugging with tracing.
Debugging scheduling blockages with tracing and callstack sampling
This article, 'Debugging scheduling blockages with tracing and callstack sampling', details the exact workflow for root-causing a scheduling blockage. It applies the concepts of tracing sched_switch and sched_waking that we covered in our last lesson.
Please read the entire article. We will break down its key stages. As you read, focus on: The Methodology: Why event-based sampling (sched_switch, sched_waking) is superior to time-based sampling for this problem. The Iterative Process: How the engineers started with a broad trace, then used filters to narrow down the investigation in successive steps. The Analysis: How they used 'woken by' links and callstacks to piece together the sequence of events. The Root Cause: The multiple factors that combined to create the problem (the lock implementation, the scheduler's behavior).
Let's dissect the workflow from the article, as it provides a template for your own investigations:
Step 1: The Hypothesis and the Right Tool
The problem was UI stutter, suggesting the main thread was getting blocked. The initial impulse for many is high-frequency sampling, but the engineers correctly identified that this is inefficient.
The key insight was to use event-based callstack sampling, triggering a callstack capture only on the events of interest: sched_switch (when the thread blocks) and sched_waking (when another thread unblocks it). This is precisely the technique we practiced in the last lesson.
Step 2: Iterative Investigation
The debugging process wasn't a single "aha!" moment. It was a methodical narrowing of focus:
- Attempt 1 (Failure): Tracing every
sched_switchon the system generated overwhelming data and caused trace buffers to overrun. This is a common beginner's mistake. - Attempt 2 (Insight): They filtered the trace to capture events only when the
systemuithread was scheduled in or out. This was manageable and revealed the first key clue: the main thread was blocking on aReentrantLock. By clicking the "woken by" link in the trace viewer, they identified the thread that released the lock. - Attempt 3 (Confirmation): A time gap remained. The main thread was blocked for 1.5ms, but the waker thread only ran for 160µs. This pointed to priority inversion: other threads were likely running in between. They added the background worker threads (
SystemUIBg-*) to the trace filter, which confirmed the theory. A chain of low-priority background threads were acquiring and releasing the lock, while the high-priority main thread waited.
Step 3: The Full Root Cause
The final analysis revealed multiple contributing factors:
- Non-PI-aware Lock: The user-space
ReentrantLockin Java is not priority-aware. It wakes waiters in FIFO order, not by priority. - Scheduler Policy: The default CFS scheduler (
SCHED_OTHER) is not "work-conserving" and may not immediately migrate a newly woken task to an idle core, leading to serialization on a single CPU. - Workload Pattern: A large number of background tasks contended for the same lock, creating a long chain of waiters.
This case study is invaluable for your interview preparation. It moves beyond a textbook definition of priority inversion to a nuanced, real-world example and demonstrates a professional, tool-driven diagnostic process.
3. Quantifying Starvation and Latency with Advanced Ftrace
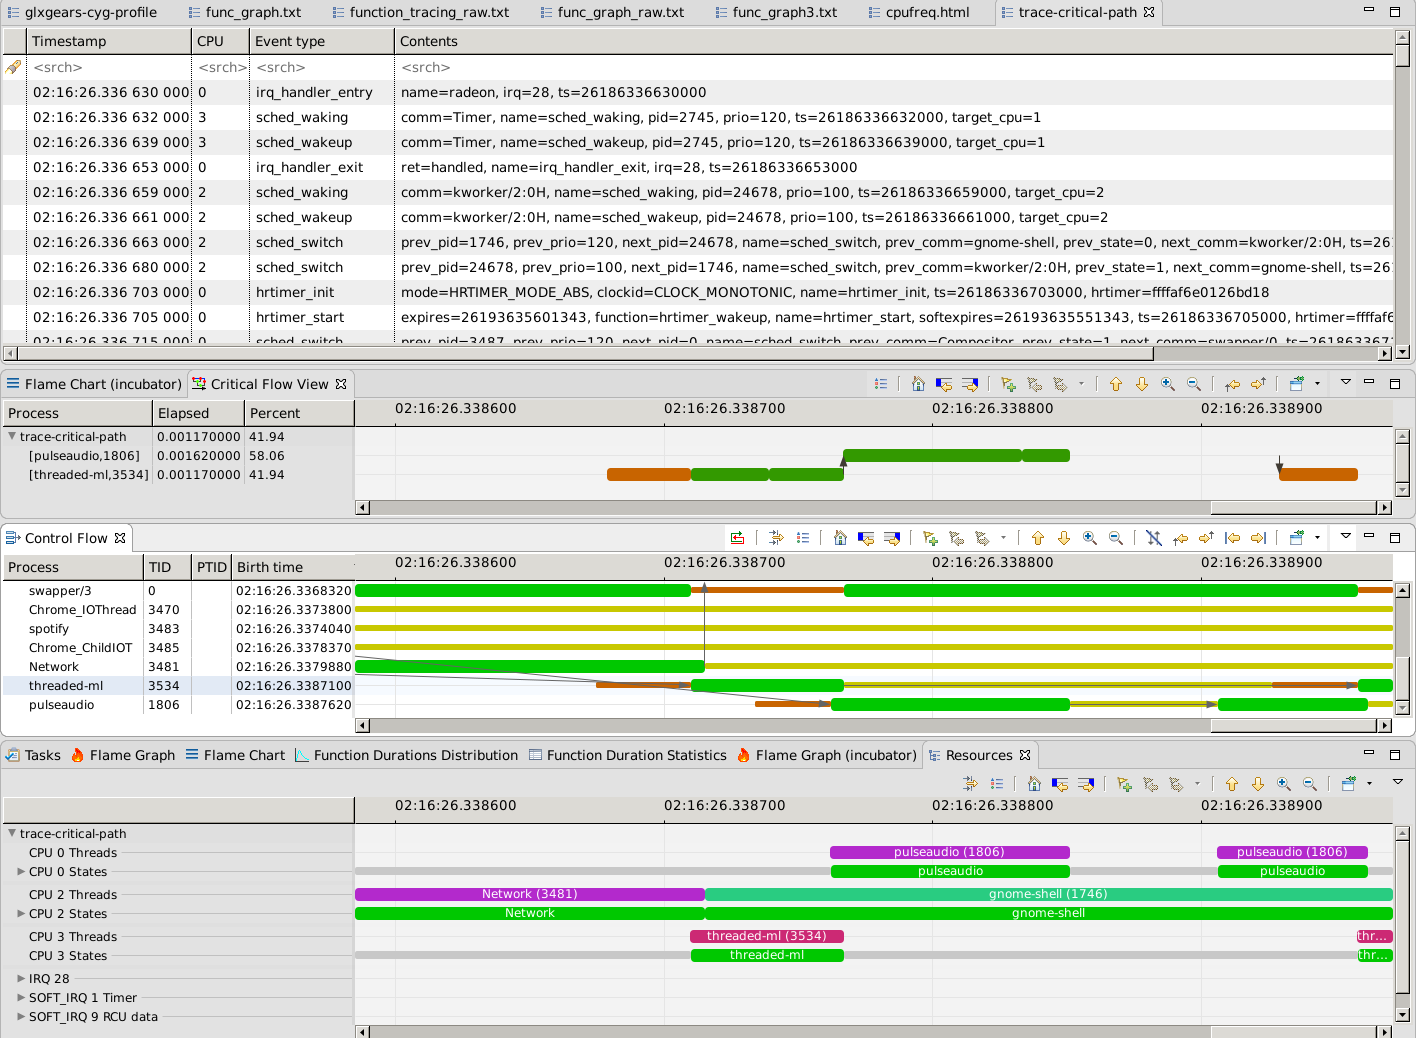
The case study focused on a blocking issue. Now let's consider a different problem: a task runs, but not often enough (starvation) or with too much delay (high latency). In the last lesson, we defined scheduling latency as the time between sched_wakeup and sched_switch. How can we measure this systematically?
Manually parsing a huge trace file is not practical. We need to have the kernel do the work for us. ftrace provides powerful mechanisms for this: kprobes and synthetic events.
LF Live Mentorship Session: Tracing with Ftrace: Critical Tooling for Linux Development
Steven Rostedt, the author of ftrace, demonstrates how to dynamically create new trace events and perform calculations in the kernel. This is a powerful technique for custom performance analysis.
Please watch these two connected sections: Kprobes for Dynamic Tracing (26:19 - 31:57): Understand how kprobes allow you to create a new trace event at any kernel function entry, even where one doesn't exist, and extract arguments. Synthetic Events and Histograms (31:57 - 39:07): This is the core of the technique. Pay close attention to how he combines two kprobes (activate_task and deactivate_task) to create a new synthetic event (activate_lat) that calculates the latency between them. The final step of creating a histogram from this synthetic event is how you can get statistical data on latency.
The technique shown in the video is directly applicable to our sched_wakeup / sched_switch problem. Here's how you would adapt it:
- Create a starting event: Enable the
sched_wakeupevent. - Create an ending event: Enable the
sched_switchevent. - Define a synthetic event: Create a synthetic event that triggers on
sched_switch. - Match events: The key is to match the
pidfrom thesched_wakeupevent with thenext_pidin thesched_switchevent. - Calculate latency: In the synthetic event definition, you subtract the timestamp of the
sched_wakeupevent from the timestamp of thesched_switchevent. - Generate a histogram: You can then direct this stream of latency values into a histogram trigger to get a statistical distribution of your task's scheduling latency, all computed efficiently inside the kernel.
This approach is extremely powerful for diagnosing tasks that are "starved" of CPU or are experiencing unacceptable jitter. A long tail in your latency histogram would be a clear indicator of a problem, prompting you to investigate what else is running on the CPU during those outlier periods.
Conclusion
You have now moved from simply observing the scheduler to actively diagnosing its failures. You have a mental model and a practical, tool-based workflow for tackling two of the most common and complex scheduling problems.
Key Takeaways:
- Priority Inversion occurs when a medium-priority task prevents a low-priority task from releasing a lock needed by a high-priority task. While kernel mutexes have priority inheritance, user-space locks or other synchronization primitives may not.
- Diagnostic Workflow: A successful diagnosis is often iterative. Start broad, then use filters to narrow your trace. Follow the "woken by" and "blocking callstack" clues to build a sequence of events.
- Event-Based Tracing is Key: For blocking/latency issues, trace on specific events (
sched_switch,sched_wakeup) rather than using random time-based sampling. - Quantify Latency with Synthetic Events: Use advanced
ftracefeatures like kprobes, synthetic events, and histograms to have the kernel measure and summarize scheduling latency for you, which is essential for diagnosing starvation and performance jitter.
In our next module, we will delve deeper into the root cause of many of these blocking scenarios: Kernel Concurrency and Synchronization. We will explore the primitives like spinlocks, mutexes, and RCU that are used to protect shared data, and learn how to use them correctly to build robust, high-performance kernel code.