Introduction
In our last lesson, we contrasted the Completely Fair Scheduler (CFS) with the real-time scheduling policies, SCHED_FIFO and SCHED_RR. We discussed the theoretical rules that govern which process gets the CPU: CFS aims for fairness using virtual runtime, while real-time policies use strict, static priorities for predictability.
Theory is essential, but to truly master the kernel, you must be able to observe its behavior directly. Today's lesson bridges that gap. We will learn how to use kernel tracing tools to observe context switches and scheduling decisions on a running system. This is a fundamental skill for debugging performance issues, diagnosing scheduler-related bugs, and verifying that your system behaves as designed—all common tasks in senior embedded roles.
We will start with the kernel's built-in tracer, ftrace, explore its user-friendly command-line interface, trace-cmd, and get a glimpse of the modern eBPF framework.
1. What is Tracing?
Before diving in, let's understand what we mean by "tracing." The Linux kernel is a complex system with thousands of things happening every second. Tracing is the act of recording specific events as they occur inside the kernel, allowing us to reconstruct a sequence of operations. These events can be function calls, returns from interrupts, or, most importantly for us today, scheduler decisions.
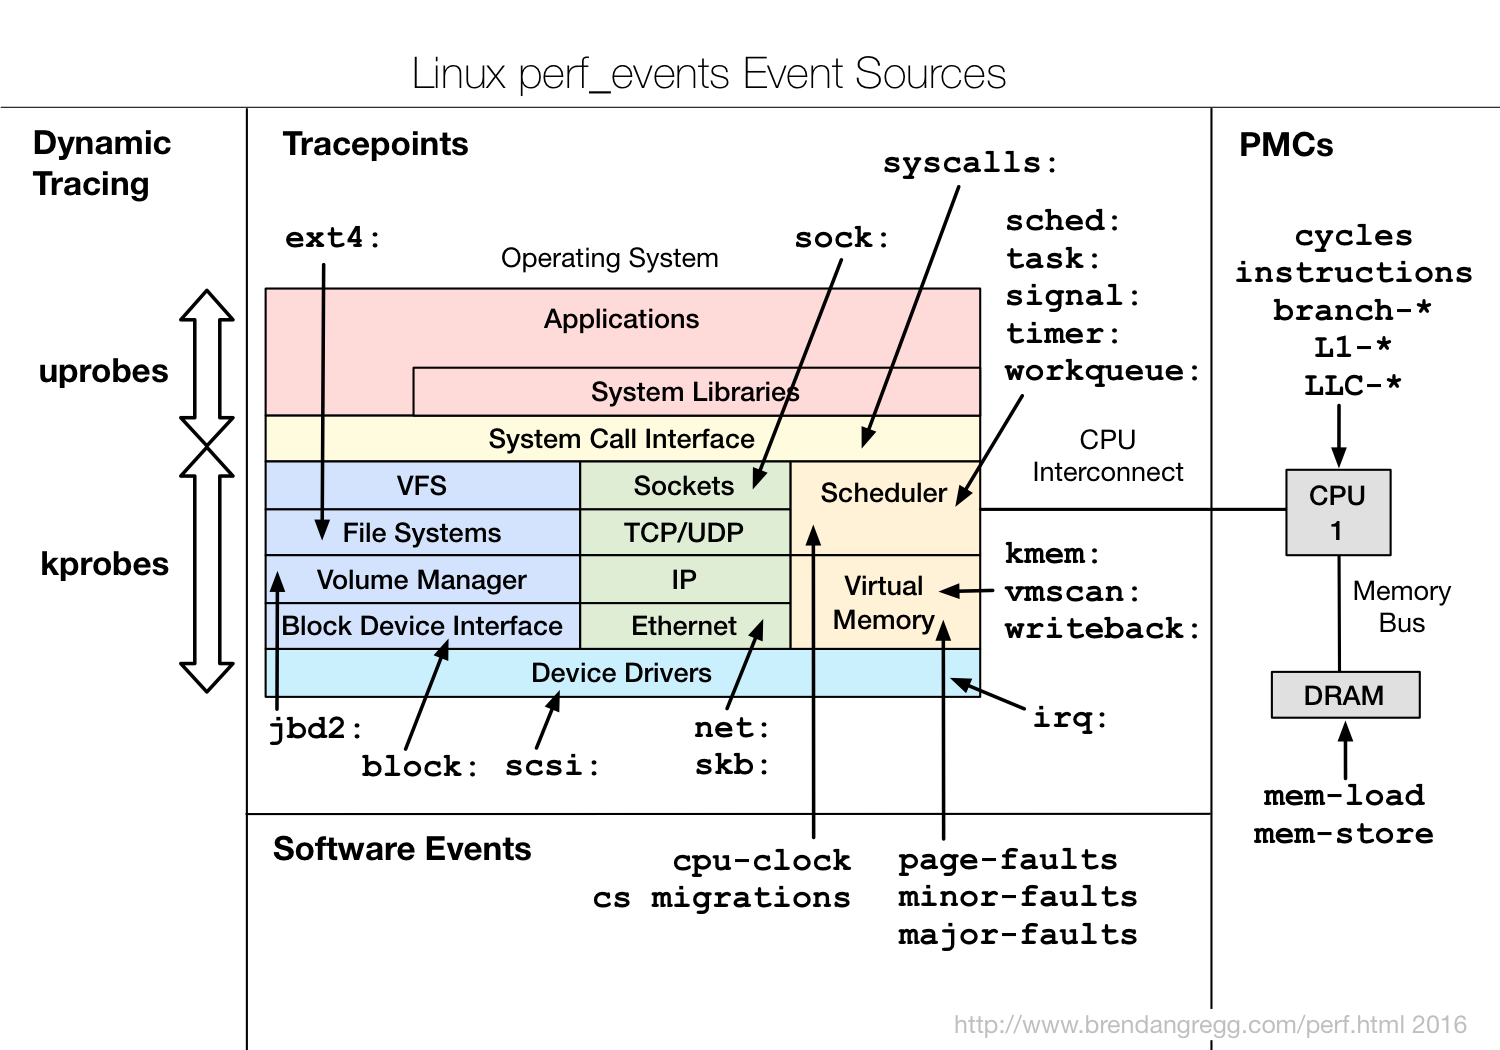
The primary tool for this is ftrace, the official tracer of the Linux kernel.
2. Exploring ftrace and tracefs
ftrace is not a single program but a framework built directly into the kernel. It exposes its controls through a special pseudo-filesystem, usually mounted at /sys/kernel/tracing or /sys/kernel/debug/tracing. Interacting with it means reading from and writing to files in this directory.
Let's watch a video from Steven Rostedt, the author of ftrace, to get a foundational overview.
See what your computer is doing with Ftrace utilities
This video, 'See what your computer is doing with Ftrace utilities', provides an excellent introduction to ftrace's purpose and its basic file system interface.
Watch the first two segments. The first part (2:20 - 3:40) explains what ftrace is and where it came from. The second part (4:34 - 6:08) shows how to mount the tracefs filesystem, which is the first step for any direct interaction with ftrace.
The key idea is that we can enable specific kernel events and then read the trace file to see a log of when those events occurred.
3. Observing Context Switches with ftrace
Let's use the raw tracefs interface to see a context switch in action. This low-level approach helps build a solid understanding of the underlying mechanics.
The most important event for our purpose is sched_switch. This event fires every time the scheduler switches the CPU from one task to another.
Step-by-Step Guide:
-
Navigate to the tracing directory (you will need root privileges for this):
cd /sys/kernel/tracing -
Ensure tracing is off and clear the old trace buffer:
echo 0 > tracing_on
echo > trace
Writing an empty string to the
tracefile clears its contents. -
Find and enable the
sched_switchevent:
Events are organized by subsystem. We can find scheduler events underevents/sched.# See available scheduler events ls events/sched # Enable the sched_switch event echo 1 > events/sched/sched_switch/enable -
Start tracing:
echo 1 > tracing_on -
Let it run for a couple of seconds while the system does some work (you can move your mouse or type in another terminal).
-
Stop tracing:
echo 0 > tracing_on -
Read the trace log:
cat trace
You will see output similar to this:
# tracer: nop
#
# entries-in-buffer/entries-written: 4/4   #P:16
#
#                                _-----=> irqs-off
#                               / _----=> need-resched
#                              | / _---=> hardirq/softirq
#                              || / _--=> preempt-depth
#                              ||| /     delay
#           TASK-PID     CPU#  ||||    TIMESTAMP  FUNCTION
#              | |         |   ||||       |         |
           bash-1836    [004] ....  4633.243916: sched_switch: prev_comm=bash prev_pid=1836 prev_prio=120 prev_state=R ==> next_comm=kworker/4:1 next_pid=123 next_prio=120
      kworker/4:1-123    [004] ....  4633.244243: sched_switch: prev_comm=kworker/4:1 prev_pid=123 prev_prio=120 prev_state=S ==> next_comm=bash next_pid=1836 next_prio=120
Interpreting the Output:
bash-1836: The task being switched out (prev_comm=bash,prev_pid=1836).[004]: The CPU core where this happened.4633.243916: The timestamp in seconds since boot.sched_switch: The name of the event.prev_state=R: The previous task was in a runnable state (R).Smeans it was sleeping (waiting for something).==>: The switch itself.next_comm=kworker/4:1: The task being switched in.
This single line tells you exactly when the scheduler made a decision, on which CPU, what task was stopped, and what task was started. By analyzing these events, you can reconstruct the exact execution history of your CPUs.
The following video provides a detailed walkthrough of this exact process.
Linux in-kernel Tracer: ftrace | DEEP LINUX
The 'Linux in-kernel Tracer: ftrace' video gives a very clear, step-by-step demonstration of enabling scheduler events and interpreting the output.
Please watch these three sections: (6:28 - 12:21): Navigating the events directory and focusing on the sched subsystem. (12:21 - 20:01): Enabling tracing, collecting events, and interpreting the output format, including the timestamp, CPU, process names, and buffer overruns. (32:52 - 40:02): Selectively enabling just the sched_switch event and inspecting its format file to understand its arguments.
4. trace-cmd: A Friendlier Frontend
While the tracefs interface is powerful, it can be cumbersome. The community created trace-cmd, a command-line tool that acts as a user-friendly frontend to ftrace. It simplifies recording and reporting traces.
ftrace: trace your kernel functions!
This article, 'ftrace: trace your kernel functions!', by Julia Evans, perfectly captures why you'd want a tool like trace-cmd and shows how to use it for tracing events.
Read the sections 'first steps with ftrace' and 'one last thing: events!'. The first section introduces trace-cmd as an alternative to raw filesystem manipulation. The second shows the exact command to trace sched:sched_switch events and explains the output.
Using trace-cmd, the entire process from the previous section becomes two simple commands:
-
Record the trace: This command enables the
sched_switchandsched_wakeupevents, starts tracing, waits for you to pressCtrl+C, and then saves the collected data to a file namedtrace.dat.# You may need to install it first: sudo apt-get install trace-cmd sudo trace-cmd record -e sched:sched_switch -e sched:sched_wakeupWhy
sched_wakeup? This event tells you when a sleeping task is marked as runnable. The time between asched_wakeupand the correspondingsched_switchis the scheduling latency—a critical metric in real-time systems. -
Report the trace: This command reads
trace.datand prints a human-readable report.sudo trace-cmd report
The trace-cmd tool handles all the echo commands, buffer management, and formatting for you.
5. A Glimpse of Modern Tracing with eBPF
While ftrace is the foundational tracing framework, the ecosystem has evolved. The most significant advancement is the extended Berkeley Packet Filter (eBPF). eBPF allows you to run small, sandboxed programs inside the kernel itself. This enables much more powerful and efficient tracing, as you can filter, aggregate, and summarize data at the source instead of dumping millions of raw events to user-space.
For a senior developer interview, being aware of eBPF and its advantages is crucial.
How eBPF Solves Real-Time Latency in Embedded Linux Systems
This article explains why eBPF is a game-changer for latency analysis and provides practical examples.
Read the sections 'How eBPF Differs from Traditional Tools' and 'Diagnosing Latency Issues with eBPF'. Pay close attention to the bpftrace one-liner that traces sched:sched_switch—it shows the power and conciseness of this modern approach.
A popular frontend for eBPF is bpftrace, which provides a high-level scripting language. The equivalent of our sched_switch trace can be done with this simple one-liner:
# You may need to install it: sudo apt-get install bpftrace
sudo bpftrace -e 'tracepoint:sched:sched_switch { printf("%s -> %s\n", args->prev_comm, args->next_comm); }'
This command attaches a small program to the sched_switch tracepoint. Each time the event fires, the program executes the printf statement inside the kernel, printing the names of the old and new tasks. This demonstrates the programmability and efficiency that eBPF brings to kernel tracing.
6. Interview Scenario: Diagnosing Scheduling Latency
Let's apply what we've learned to a typical interview question.
Scenario: You are working on an automotive system where a high-priority SCHED_FIFO task is responsible for a critical control loop. You suspect it's experiencing sporadic delays and not getting the CPU as quickly as it should after being woken up. How would you investigate this using kernel tracing?
Your Thought Process and Answer:
-
Identify the Key Events: The problem is about the delay between a task becoming runnable and it actually running. This translates to two kernel events:
sched_wakeup: Occurs when the task is marked runnable (e.g., its timer expires or I/O completes).sched_switch: Occurs when the task is actually placed on the CPU.
The time difference between these two events is the scheduling latency.
-
Choose the Right Tool:
trace-cmdis an excellent choice. It's standard, powerful, and easy to use. -
Formulate the Command:
sudo trace-cmd record -e sched_wakeup -e sched_switchI would run this command while the system is exhibiting the problem.
-
Analyze the Trace Data:
After stopping the trace, I would runtrace-cmd report | grep 'my_task_name'.- First, I'd find a
sched_wakeupevent for my task's PID. I'd record the timestamp. - Next, I'd find the first
sched_switchevent after that wakeup where my task appears as thenext_comm. I'd record its timestamp. - The difference between these two timestamps is the latency for that specific instance.
- First, I'd find a
-
Pinpoint the Cause:
The crucial step is to look at thesched_switchevents that occurred on the same CPU during that latency window. Theprev_commfield in those events will tell me exactly what other task(s) were running on the CPU, preventing my high-priority task from executing. This could reveal:- A higher-priority real-time task was running (correct behavior).
- The kernel was stuck in an interrupt handler for a long time (a driver bug).
- Another task of the same priority was running, and I should reconsider my priority assignments.
-
Mention Advanced Techniques: For bonus points, I would mention that for long-term monitoring, a simple trace can generate too much data. A better approach would be to use an
eBPFscript (withbpftraceor BCC) to calculate the latency in-kernel and only export statistics or outliers, which is far more efficient.
Conclusion
You have now learned how to peer inside the kernel and see the scheduler at work. This is no longer a theoretical black box. You have the tools to verify its behavior and diagnose real-world problems.
Key Takeaways:
ftraceis the Linux kernel's built-in tracing framework, controlled via thetracefspseudo-filesystem.- The
sched:sched_switchevent is the fundamental tracepoint for observing context switches and scheduling decisions. trace-cmdis a user-friendly command-line tool that simplifies recording and reportingftracedata.eBPFandbpftracerepresent the modern, programmable approach to kernel tracing, offering superior efficiency and flexibility for complex analysis.- By tracing
sched_wakeupandsched_switch, you can precisely measure scheduling latency, a critical performance metric.
In our next lesson, we will put this new skill to the test. We will be presented with a scenario-based scheduling problem, such as priority inversion or CPU starvation, and use these tracing techniques to diagnose the root cause and propose a solution.