Introduction
Welcome to the next lesson in our module on Hardware-Assisted Virtualization. In our previous session, we explored the theory of paravirtualization and the VirtIO framework. We learned how VirtIO replaces slow, trap-heavy emulated I/O with an efficient, batched communication mechanism based on virtqueues. However, we also identified that the standard "pure VirtIO" data path still has a bottleneck: the context switch between the host kernel (KVM) and the QEMU userspace process.
Today, we move from theory to practice. Our learning outcome is to set up a KVM-based VM using QEMU and observe VM exits using kernel tracing tools. This hands-on experience is crucial for any developer working on virtualization or low-level performance analysis. You will learn how to launch a KVM-accelerated VM, enable the kernel's built-in tracing infrastructure, and see the very VM exits we've been discussing in real time. This practical skill will form the foundation for diagnosing complex performance issues, which we'll tackle in the next lesson.
1. Preparing Your Host for KVM
Before we can launch a VM, we need to ensure your host machine is properly configured for KVM. This involves two main steps: verifying that your CPU supports hardware virtualization and installing the necessary software packages.

Step 1: Verify Hardware Support
KVM requires CPU virtualization extensions, either Intel VT-x or AMD-V (also known as AMD-SVM). You can quickly check if your CPU supports these and if they are enabled in the BIOS.
Getting Started with Kernel-based Virtual Machine (KVM) - Leonard Sheng Sheng Lee, Computas
The video 'Getting Started with Kernel-based Virtual Machine (KVM)' provides a clear, practical guide to this initial setup. We'll use it to walk through the verification and installation steps.
Please watch from 09:59 to 14:10. The speaker demonstrates how to use grep on /proc/cpuinfo to check for the vmx (Intel) or svm (AMD) flags. If these flags are not present, it often means virtualization needs to be enabled in your system's BIOS/UEFI settings.
On your Linux host, you can run the following command:
egrep -c '(vmx|svm)' /proc/cpuinfo
If the output is greater than 0, your CPU has the required features. If it's 0, you may need to enable virtualization in your BIOS/UEFI.
Step 2: Install Virtualization Packages
Next, you need to install QEMU, KVM, and other essential virtualization management tools.
Getting Started with Kernel-based Virtual Machine (KVM) - Leonard Sheng Sheng Lee, Computas
The same video also covers the package installation for various Linux distributions.
Now watch from 15:04 to 17:28. This section covers the packages needed for both Debian/Ubuntu-based and Red Hat/Fedora-based systems. It also shows how to ensure the kvm kernel modules are loaded correctly using lsmod.
For a Debian/Ubuntu system, a typical command would be:
sudo apt-get install qemu-kvm libvirt-daemon-system libvirt-clients bridge-utils virt-manager
For a Fedora/CentOS/RHEL system:
sudo dnf install @virtualization
After installation, ensure your user is part of the libvirt and kvm groups to manage VMs without needing sudo for every command:
sudo usermod -aG libvirt $(whoami)
sudo usermod -aG kvm $(whoami)
You will need to log out and log back in for these group changes to take effect.
2. Launching a KVM-Accelerated VM with QEMU
While tools like virsh and virt-manager provide a high-level interface for managing VMs, for kernel development and debugging, it's often more powerful to work directly with the QEMU command line. This gives you fine-grained control over every aspect of the virtual machine.
You've already gained experience compiling your own kernel. QEMU allows you to boot that kernel directly, which is perfect for a rapid development and testing cycle.
Kernel Recipes 2015 - Speed up your kernel development cycle with QEMU - Stefan Hajnoczi
In the talk 'Speed up your kernel development cycle with QEMU', Stefan Hajnoczi provides an excellent walkthrough of a typical kernel developer's workflow using QEMU. Let's look at the specific command-line options for launching a VM with a custom kernel.
Please watch from 12:42 to 14:13 and then from 17:36 to 18:09. Focus on these key QEMU options: -enable-kvm: This is the crucial flag that tells QEMU to use the KVM kernel module for hardware acceleration. -kernel: Specifies the path to the guest kernel image (e.g., your compiled bzImage or vmlinux). -initrd: Specifies an initial RAM disk, which can contain a minimal root filesystem and test scripts. -append: Passes command-line arguments to the guest kernel. -nographic and -serial stdio: Redirects the guest's serial console to your host terminal, which is ideal for debugging.
Here is a complete example command to launch a VM. This assumes you have a compiled x86_64 kernel (bzImage), a root filesystem image (rootfs.img), and you want to allocate 2 CPU cores and 2GB of RAM.
qemu-system-x86_64 \
  -enable-kvm \
  -m 2G \
  -smp 2 \
  -kernel ./bzImage \
  -hda ./rootfs.img \
  -append "root=/dev/sda console=ttyS0" \
  -nographic
For today's exercise, you can use a pre-built cloud image which combines the kernel and rootfs for convenience. You can download a minimal CirrOS image here:
wget http://download.cirros-cloud.net/0.6.2/cirros-0.6.2-x86_64-disk.img
Then launch it with this command:
qemu-system-x86_64 \
  -enable-kvm \
  -m 1G \
  -smp 1 \
  -drive file=cirros-0.6.2-x86_64-disk.img,format=qcow2 \
  -nographic
You should see the guest OS boot and eventually present you with a login prompt (user: cirros, password: gocubsgo). You can exit the QEMU session by pressing Ctrl-a then x.
3. Observing VM Exits with Kernel Tracing
Now for the core of today's lesson. With a VM running, we can use the host's kernel tracing tools to observe the interactions between the guest and KVM.
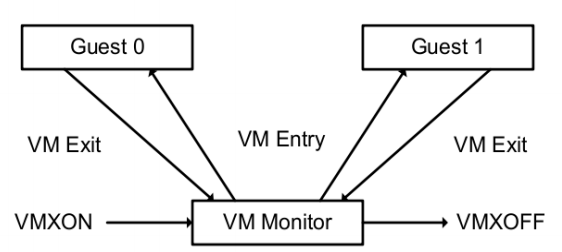
The primary tool we'll use is ftrace, a powerful and low-overhead tracer built directly into the Linux kernel. We can interact with it via the debugfs filesystem, typically mounted at /sys/kernel/debug/tracing/.
The GitHub Gist 'Tracing QEMU-KVM Interactions' provides a concise set of commands for tracing VM exits using both perf and ftrace.
Please review the section 'Tracking VM-KVM Interactions'. It provides the two main methods we will use: one for getting aggregate statistics with perf, and one for getting a live trace stream with ftrace.
Practical Exercise: Tracing Live VM Exits
Let's put this into practice.
1. Launch your VM:
In one terminal, start the CirrOS VM again using the QEMU command from the previous section. Log in to the guest.
2. Get Aggregate Statistics with perf:
In a second terminal on your host, run the following command. This will count all KVM-related tracepoint events system-wide over a 5-second period.
sudo perf stat -e 'kvm:*' -a -- sleep 5
You will see output showing the counts of different events like kvm_entry, kvm_exit, kvm_msr, etc. Even with an idle guest, you'll see thousands of exits, many of them due to the HLT instruction, where the guest CPU tries to enter a sleep state.
3. Generate a Workload:
Inside the guest VM's terminal, generate some I/O activity. A simple command will do:
# This command continuously reads from a block device and discards the output.
# It will generate a lot of I/O-related VM exits.
dd if=/dev/vda of=/dev/null
While this is running, execute the perf stat command again on the host. You should see a significant increase in the number of VM exits, particularly for reasons related to I/O.
4. View the Live Trace with ftrace:
Now let's get a more detailed, real-time view. On the host, first enable all KVM tracepoints:
# This command might require you to be root or use sudo
echo 1 | sudo tee /sys/kernel/debug/tracing/events/kvm/enable
Then, stream the trace buffer to your terminal:
sudo cat /sys/kernel/debug/tracing/trace_pipe
You will see a continuous flood of text. Each line represents a kernel event. With your dd command still running in the guest, you should be able to see kvm_exit events scrolling by. Look for lines like this:
qemu-system-x86-1337 [000] ..s. 12345.67890: kvm_exit: reason IO_INSTRUCTION rip 0xffffffff8107b5a0 info 78 4
This line tells you:
- The process is
qemu-system-x86. - The event is
kvm_exit. - The
reasonisIO_INSTRUCTION. This is a classic trap-and-emulate exit for port I/O. ripis the instruction pointer in the guest at the time of the exit.
To stop the trace, press Ctrl-c in the cat terminal and then disable the tracepoints:
echo 0 | sudo tee /sys/kernel/debug/tracing/events/kvm/enable
4. Interpreting the Results and Deeper Analysis
By observing the reason code in the kvm_exit trace, you can begin to understand why your VM is exiting to the host. The resource LINK contains a list of these exit reasons at the end of the document. Common ones you might see include:
KVM_EXIT_HLT: The guest executed theHLT(halt) instruction, putting the vCPU to sleep.KVM_EXIT_IO: The guest attempted to perform port I/O, which is trapped and emulated by QEMU.KVM_EXIT_MMIO: The guest accessed a memory-mapped I/O address that KVM is configured to trap.KVM_EXIT_INTR: KVM is notifying the vCPU of a pending external interrupt.KVM_EXIT_EPT_VIOLATIONorEPT_MISCONFIG: An exit related to memory management and the Extended Page Tables. This can indicate anything from a normal page fault to a bug in the guest's page table setup.
For a fantastic real-world example of how these tracing tools are used to solve a complex bug, I highly recommend reading the following blog post.
Debugging QEMU/KVM Setup If Something Goes Wrong...
The blog post 'Debugging QEMU/KVM Setup If Something Goes Wrong...' is a masterclass in using tracing to debug a KVM issue. The author encounters a cryptic KVM internal error and systematically uses perf, ftrace, and systemtap to drill down to the root cause: an unsupported CPU feature for 1GB huge pages.
Read through this post to see a professional debugging workflow in action. You don't need to reproduce the steps, but focus on the methodology: Start Broad: Use trace-cmd to capture all KVM tracepoints to get an initial clue (EPT_MISCONFIG). Go Deeper: Enable more specific kvm_mmu tracepoints to understand the page table walk error. Identify the Root Cause: Correlate the trace logs with the KVM source code to realize the issue is a missing CPUID feature in the guest. Find the Solution: Correct the QEMU command line to enable the necessary CPU feature.
This example perfectly illustrates the power of the tools you've just learned and aligns directly with your goal of deep kernel debugging.
Interview Scenario
Interviewer: "We've deployed a VM running a legacy application that relies on an emulated serial port for communication. Performance is poor, and monitoring shows high CPU usage on the host. You suspect the cause is excessive VM exits. How would you verify this and pinpoint the cause?"
Your Thought Process:
- Hypothesis: The legacy app's reliance on an emulated serial port is likely causing frequent
KVM_EXIT_IOtraps as it communicates byte-by-byte. - Verification Step 1 (Aggregate): "First, I would use
perf stat -e 'kvm:*' -p <QEMU_PID>while the application is running to get a baseline. I'd look for a very high rate ofkvm_exitevents per second, confirming that virtualization overhead is a major factor." - Verification Step 2 (Detailed Trace): "Next, I would use
ftraceto get a detailed view. I would enable thekvmtracepoints and stream the output fromtrace_pipe. I would expect to see a flood ofkvm_exitevents with the reasonIO_INSTRUCTION, confirming that port I/O is the primary driver of the exits." - Pinpointing the Cause: "By correlating the timestamps of the traces with the application's activity, I could definitively link the high exit rate to the serial port communication. The
rip(instruction pointer) value in the trace could even be used with the guest kernel's symbol file to identify the exact driver code (inb/outbinstructions) causing the traps." - Proposed Solution: "Based on this analysis, the long-term solution would be to modify the application to use a more efficient communication mechanism, like a
virtio-serialdevice, which would batch communications and dramatically reduce the number of VM exits."
Conclusion
In this lesson, you've taken a significant step from theory to practice. You now have the fundamental skills to set up a virtualized environment and peer directly into the heart of its operation.
Key Takeaways:
- You can set up a KVM-accelerated VM using a direct QEMU command line, giving you maximum control for development and debugging.
- The
perf statcommand provides a high-level overview of VM exit statistics. - The kernel's
ftracefacility (/sys/kernel/debug/tracing) allows you to capture a live, detailed stream of KVM events. - By analyzing the
reasoncode inkvm_exittraces, you can determine the cause of guest-to-host transitions.
Preview of the Next Lesson:
You can now observe and identify VM exits. In our next lesson, we will put this skill to the test. You will be tasked to diagnose a VM performance issue caused by excessive VM exits and identify mitigation strategies. We will create a specific performance problem and use the tools you learned today to analyze it, then explore advanced solutions like vhost to resolve the underlying bottleneck.