Introduction
Welcome to the final lesson in our module on Hardware-Assisted Virtualization and KVM. In our last session, you gained practical experience setting up a KVM-based VM and using powerful tracing tools like perf and ftrace to observe VM exits in real time. You learned that guest actions like I/O or executing privileged instructions can trigger a hardware-enforced transition to the host hypervisor—a VM exit.
Today, we'll build directly on that foundation. Our goal is to diagnose a VM performance issue caused by excessive VM exits and identify mitigation strategies. We will move from simply observing exits to interpreting them as a performance bottleneck and then implementing solutions to fix them. This is a critical skill for anyone working on performance-sensitive virtualized systems, such as in telecommunications (NFV) or automotive domains, where predictable latency is paramount.
1. Understanding the Performance Bottleneck: The "Pure VirtIO" Data Path
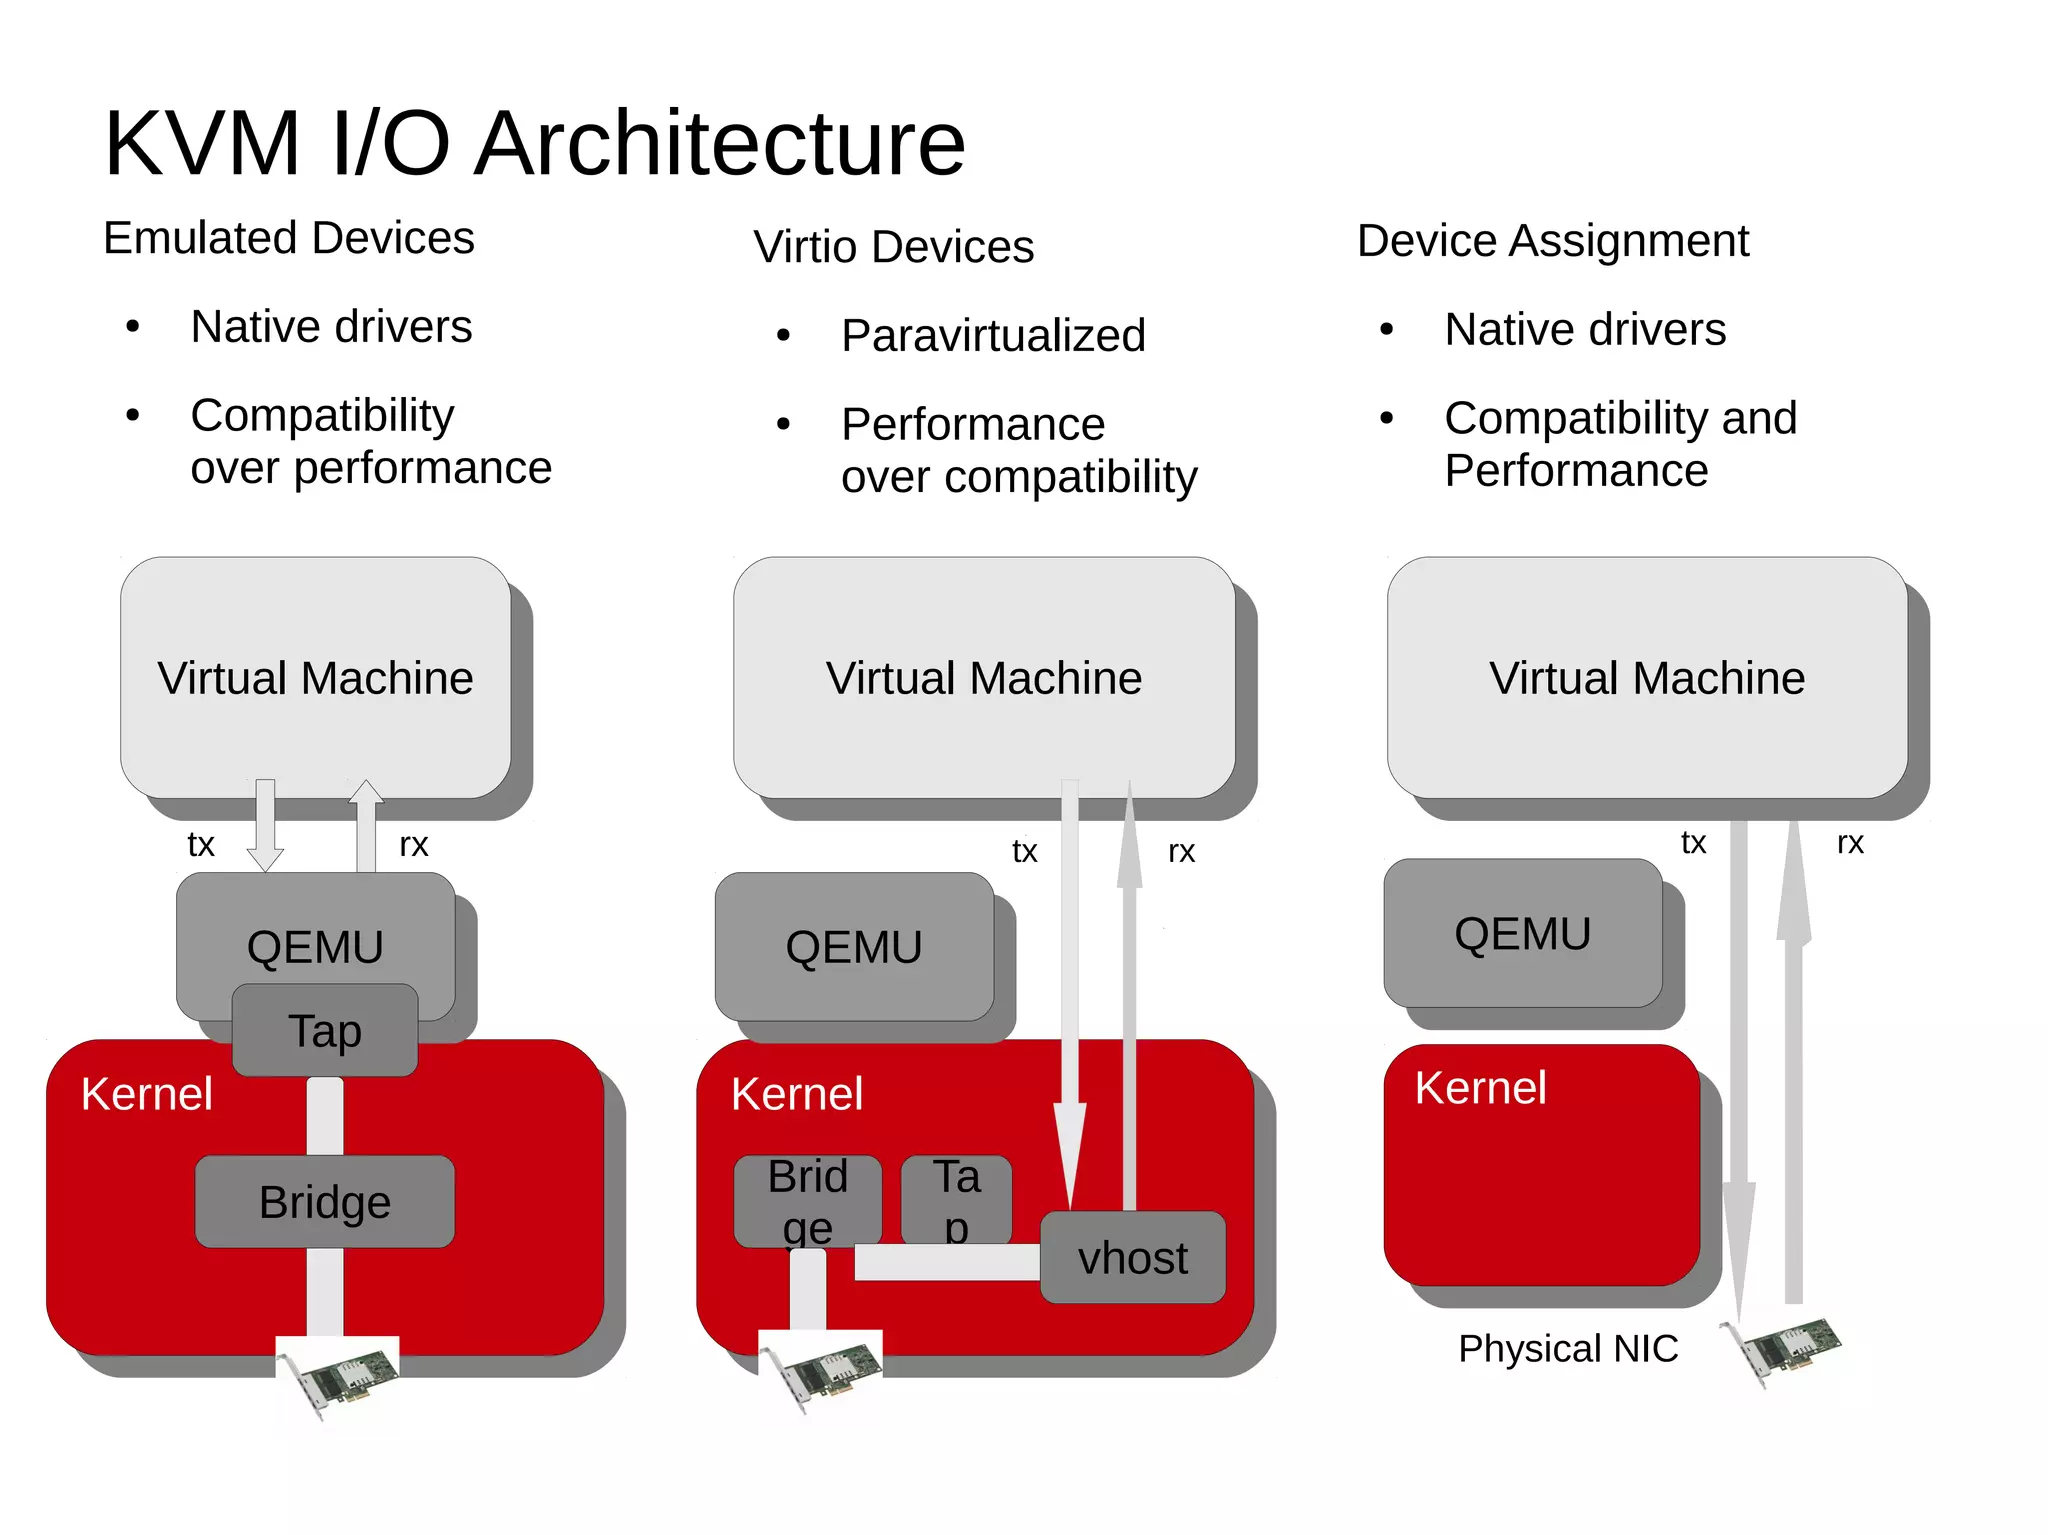
Before we can fix a problem, we must understand its root cause. For many I/O-intensive workloads, the primary source of virtualization overhead isn't the VM exit itself, but the entire data path that follows. In a standard KVM/QEMU setup (which we can call "pure VirtIO" or "VMM-terminated VirtIO"), the QEMU userspace process acts as a middleman for all I/O.
This architecture, while flexible, introduces significant overhead. Let's examine why.
Introduction to VirtIO, Part 2: Vhost
The article 'Introduction to VirtIO, Part 2: Vhost' from Oracle's Linux blog provides an excellent breakdown of this problem. It clearly explains the sources of overhead in a pure VirtIO setup.
Please read the first two sections of the article: 'Context: VirtIO Data Plane Overhead' and 'Limitations of Pure VirtIO'. As you read, pay close attention to: Figure 1 and Figure 2, which illustrate the data path through the guest kernel, QEMU, and the host kernel. The two dominant sources of overhead: context switches (between the host kernel and the QEMU userspace process) and VM exits/entries (between the guest and the host). The step-by-step walk-through of the Transmit (Tx) and Receive (Rx) paths. Try to visualize how a single packet triggers this chain of events.
To summarize the key points from the reading:
- Transmit (Guest -> Host): When a guest wants to send a packet, it places data in the virtqueue and "kicks" the host. This kick is a privileged operation that causes a VM Exit. KVM then has to wake up the QEMU process, causing a context switch from kernel space to user space. QEMU processes the packet and uses a syscall to send it to the host's network stack, which is another transition (though less expensive).
- Receive (Host -> Guest): When a packet arrives for the VM, the host kernel notifies QEMU, causing a context switch. QEMU copies the data into the virtqueue and then makes another syscall to KVM to inject a virtual interrupt into the guest, a process which involves a VM Exit/Entry cycle.
For every round trip of a packet, we pay a heavy price in context switches and VM exits. While this is acceptable for low-intensity workloads, it quickly becomes a bottleneck for high-throughput applications like network appliances or high-speed data acquisition systems.
2. Scenario-Based Diagnosis: High Network Packet Loss
Let's simulate a real-world performance problem. Imagine a Network Function Virtualization (NFV) appliance that is dropping packets under heavy load. Your task is to diagnose the root cause.
A common symptom of the overhead we just discussed is the host's inability to service the guest's I/O requests quickly enough. For networking, this can manifest as packet drops on the host's virtual tap interface, because the guest's vCPU is too busy or gets preempted and cannot drain its receive queue fast enough.
OVS-DPDK End to End Troubleshooting Guide
The 'OVS-DPDK End to End Troubleshooting Guide' from Red Hat provides excellent, practical scenarios for diagnosing virtualization performance issues. We'll use a specific chapter to reproduce and diagnose packet loss.
Please read Chapter 4, 'High Packet Loss in the TX Queue of the Instance’s Tap Interface'. Focus on the 'Symptom' and 'Diagnosis' sections. The key takeaway is that TX drops on the host's tap interface correspond to RX drops from the VM's perspective. This happens when the guest vCPU cannot keep up with the incoming packet rate because of processing overhead or scheduler interference on the host.
Practical Exercise: Reproducing and Diagnosing the Bottleneck
Now, let's get our hands dirty. The resource you just read provides a diagnostic script to demonstrate this exact problem. We will adapt it for our use.
1. Setup:
- Launch the CirrOS VM you used in the previous lesson. Make sure you can log in.
- Find the name of the
tapinterface created by QEMU for your VM on the host. You can find this withip linkand it will typically be named something liketap0or have a name related to the VM. - Find the IP address of your VM. You can find this by running
ip addrinside the guest.
2. The Experiment:
The script in the troubleshooting guide uses hping3 to flood the VM with packets and dd to create CPU contention. We will replicate this logic.
-
On the host (Terminal 1): Start flooding the VM with UDP packets. Replace
<VM_IP>with your guest's IP address. You may need to installhping3(sudo apt install hping3orsudo dnf install hping3).# This will send packets as fast as possible. sudo hping3 -u -p 5000 <VM_IP> --faster -
On the host (Terminal 2): While the flood is running, monitor the tap interface statistics. Run this command several times and watch the
droppedcounter in theTXline. Replace<tap_device>with your VM's tap interface name.ip -s link show <tap_device>Initially, you might not see many drops if the system is not under load.
-
On the guest (Terminal 3): Now, start a CPU-intensive task inside the VM to simulate a busy application that can't service the network queue promptly.
# This will consume 100% of a CPU core. dd if=/dev/zero of=/dev/null -
On the host (Terminal 2): With both the packet flood and the
ddcommand running, check the tap interface statistics again.ip -s link show <tap_device>You should now see the
droppedpacket count increase rapidly. This is our diagnosed symptom.
3. Connecting to VM Exits:
The packet drops are the symptom, but excessive VM exits are the cause. Let's prove it.
- On the host (Terminal 4): Find the Process ID (PID) of your
qemu-system-x86_64process.pgrep qemu-system-x86 - Now, use
perfto measure the KVM exit rate for just that process while the experiment is running.
You will see a very high rate of VM exits per second, confirming our hypothesis that the high packet rate is causing a storm of guest-to-host transitions. You can add more tracepoints likesudo perf stat -e 'kvm:kvm_exit' -p <QEMU_PID> -I 1000kvm:kvm_io_instructionto see the specific causes.
3. Mitigation Strategies
Now that we've diagnosed the problem, let's fix it. The core issue is the overhead of QEMU being in the data path. The solution is to get it out of the way.
Mitigation 1: vhost-net
The most common and effective solution is to use vhost-net. This is a kernel module that takes over the data plane processing from QEMU. Packets can now move directly between the guest's virtqueue memory and the host's kernel networking stack, completely bypassing the expensive context switch to the QEMU userspace process.
Introduction to VirtIO, Part 2: Vhost
Let's return to the 'Introduction to VirtIO, Part 2: Vhost' article. It provides a clear explanation and diagrams of the vhost architecture.
Please read the sections 'Kernel-based Vhost Architecture' and its 'Overhead Cost' subsection. Focus on: Figure 4 and Figure 5, which show the new, streamlined data path. How context switches are eliminated from the data path. The role of ioeventfd and irqfd, which allow notifications to happen efficiently within the kernel, further reducing VM exit overhead.
Applying the Mitigation:
To enable vhost-net, you simply add vhost=on to your QEMU network device configuration.
- Stop your previous QEMU instance.
- Restart it with the modified network command.
qemu-system-x86_64 \ -enable-kvm \ -m 1G \ -smp 1 \ -drive file=cirros-0.6.2-x86_64-disk.img,format=qcow2 \ -netdev tap,id=net0,vhost=on \ -device virtio-net-pci,netdev=net0 \ -nographic - Repeat the experiment from Section 2. Run the packet flood from the host and the
ddcommand in the guest. - Monitor the
ip -s link show <tap_device>output. You should see a dramatic reduction in (or elimination of) dropped packets. The performance is significantly better because the host kernel can now handle the packet forwarding directly without the QEMU bottleneck.
Mitigation 2: CPU Affinity and Isolation
Even with vhost-net, performance can be impacted by the host's scheduler. If a vCPU thread is running on a physical CPU (pCPU) and the host scheduler decides to preempt it to run another task (e.g., a system daemon), the guest's execution is paused. For a real-time NFV workload, this preemption can cause unacceptable jitter and packet loss.
A powerful mitigation strategy, especially for performance-critical systems, is to dedicate physical CPUs to guest vCPUs and isolate them from the host scheduler.
OVS-DPDK End to End Troubleshooting Guide
The Red Hat troubleshooting guide provides a wealth of information on this topic, explaining why isolating CPUs and correctly placing emulator threads is so important.
Please read the 'Solution' sections in Chapter 5 and Chapter 13. Chapter 5.3 'Solution': Introduces the concept of using IsolcpusList and NovaVcpuPinSet to separate host tasks from guest vCPUs. This is the core idea of CPU pinning. Chapter 13 'Using virsh emulatorpin...': This is an advanced but critical topic. It explains that QEMU has its own 'emulator threads' for handling I/O, and if these threads run on the same pCPU as a performance-critical vCPU, they will cause interference. The solution is to pin these emulator threads to a separate 'housekeeping' CPU.
The key strategies are:
isolcpus: A kernel boot parameter that removes specified CPUs from the general scheduler's control. These CPUs will only run tasks that are explicitly assigned to them.- vCPU Pinning: Using tools like
tasksetor libvirt'svcpupin, you assign each of a VM's vCPU threads to a specific, isolated pCPU. - Emulator Thread Pinning: You pin the main QEMU process and its I/O threads to a non-isolated CPU (a "housekeeping" core), ensuring they don't interfere with the high-performance vCPUs.
This level of tuning ensures that your performance-critical vCPUs have exclusive access to physical cores, providing the lowest possible latency and preventing preemption by the host OS.
Interview Scenario
Interviewer: "We are deploying a latency-sensitive application inside a KVM virtual machine. Under high network traffic, we are seeing unacceptable performance and packet loss. Your initial analysis with perf shows a very high rate of VM exits. What is your step-by-step plan to diagnose and resolve this?"
Your Thought Process:
-
Identify the likely cause: "A high rate of VM exits correlated with network traffic strongly suggests that the standard VirtIO data path is the bottleneck. The overhead comes from frequent context switches between the host kernel and the QEMU userspace process for every packet."
-
Confirm the Diagnosis: "First, I'd confirm the packet loss by monitoring the TX
droppedcounter on the host'stapinterface for the VM usingip -s link. Second, I would useftraceorperf traceto confirm that the dominant VM exit reasons are I/O related, such asIO_INSTRUCTIONor MMIO traps for the virtio device." -
Propose Mitigation Strategy (Level 1): "The first and most impactful mitigation is to enable
vhost-net. This offloads the data plane from QEMU to the host kernel, eliminating the context-switch overhead. I would add thevhost=onoption to the VM's-netdevconfiguration and re-run the tests to confirm that packet loss is eliminated and VM exit rates are reduced." -
Propose Mitigation Strategy (Level 2 - Advanced): "If latency is still a concern, the next step is to address scheduler interference. I would propose a CPU isolation strategy:
- Use the
isolcpuskernel boot parameter to reserve a set of physical cores for the VM. - Pin the VM's vCPU threads to these isolated cores.
- Crucially, I would also ensure that the QEMU emulator threads are pinned to a different, non-isolated 'housekeeping' core. This prevents them from preempting the data plane vCPUs and introducing jitter. This comprehensive isolation ensures deterministic, low-latency performance for the application."
- Use the
Conclusion
Today you have bridged the gap between observing a phenomenon (VM exits) and solving a real-world engineering problem. You've learned how to diagnose a performance bottleneck and apply powerful mitigation strategies.
Key Takeaways:
- The "pure VirtIO" data path through QEMU userspace creates significant overhead due to context switches and VM exits, which can lead to packet loss in I/O-intensive VMs.
- You can diagnose this by correlating high VM exit rates (
perf) with symptoms like dropped packets on the hosttapinterface (ip -s link). vhost-netis the primary mitigation, moving the data plane into the host kernel to eliminate the QEMU bottleneck.- For ultimate performance, CPU pinning and isolation prevent host scheduler interference, providing deterministic low latency for vCPUs.
Preview of the Next Module:
We have now concluded our deep dive into KVM and hardware-assisted virtualization. You have a solid understanding of how VMs work from the CPU and I/O perspective. In our next module, PCIe Subsystem Internals, we will shift our focus to the physical hardware layer. We will begin by exploring the PCIe layered architecture, understanding how devices like NICs, GPUs, and storage controllers communicate with the CPU. This knowledge is fundamental to writing device drivers and understanding advanced hardware features like IOMMU and device assignment (passthrough), which are the ultimate form of I/O performance in virtualization.