Hello! Welcome back to our course on FP&A.
In our last lesson, we constructed the crucial link between the Income Statement and the Balance Sheet by building the shareholders' equity schedules. We saw how Net Income flows into Retained Earnings, and how activities like paying dividends or repurchasing stock—which we'll use today—are modeled as changes in the equity section.
This lesson is the logical next step in building our integrated model. We will now derive the cash flow statement from the income statement and changes in balance sheet accounts. The Cash Flow Statement (CFS) is the ultimate reconciliation statement; it explains exactly how a company's cash balance changed from the beginning of a period to the end. It bridges the accrual-based Income Statement with the cash balance on the Balance Sheet. Your civil engineering background has given you a strong grasp of systems and flows, which is very analogous to how cash moves through a business.
By the end of this 60-minute lesson, you will be able to:
- Explain the structure of the Cash Flow Statement and its three main sections.
- Calculate Cash Flow from Operations (CFO) by adjusting Net Income for non-cash expenses and changes in working capital.
- Calculate Cash Flow from Investing (CFI) and Cash Flow from Financing (CFF) using data from the Balance Sheet and supporting schedules.
- Construct a complete cash roll-forward to calculate the ending cash balance.
Let's begin.
1. The Conceptual Framework: From Accrual to Cash
Before we start linking cells in Excel, it's vital to understand the "why" behind the Cash Flow Statement. It answers a simple question: "Where did the cash come from, and where did it go?" It does this by taking the accrual-based Net Income and adjusting it to reflect actual cash movements.
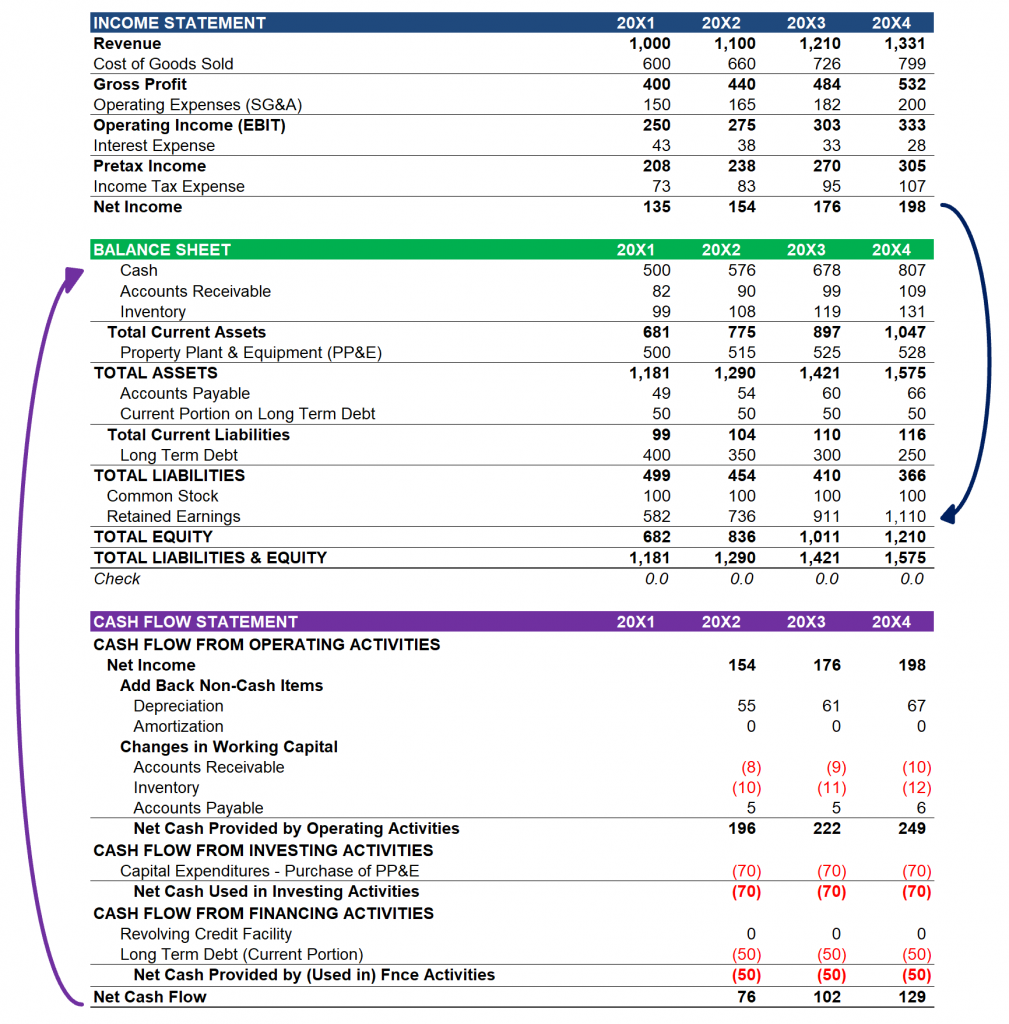
The CFS is universally broken down into three activities:
- Cash Flow from Operations (CFO): Cash generated or used by the core business operations.
- Cash Flow from Investing (CFI): Cash used for or generated from long-term investments (like buying equipment).
- Cash Flow from Financing (CFF): Cash flows between the company and its owners (equity) and lenders (debt).
To solidify these concepts, let's turn to a clear textual explanation.
How are the Three Financial Statements Linked?
The article 'How are the Three Financial Statements Linked?' from Wall Street Prep clearly explains the conceptual connections we are about to build. It provides the foundational theory for our practical exercise.
Please read the sections titled 'How are the Income Statement and Cash Flow Statements Linked?' and 'How are the Cash Flow Statement and Balance Sheet Linked?'. Focus on understanding the role of Net Income, non-cash expenses, and the impact of changes in balance sheet accounts on cash.
As the article explains, the entire process is a reconciliation. We start with a profit number (Net Income) and methodically adjust it for every transaction that did not involve an equal and immediate exchange of cash.
2. Deriving Cash Flow from Operations (CFO)
The CFO section is often considered the most important as it reflects the cash-generating power of a company's core business. We build it using the indirect method, which involves these key steps:
Step 1: Start with Net Income
The very first line of the CFO section is Net Income, linked directly from the bottom of the Income Statement.
Step 2: Add Back Non-Cash Expenses
The most common non-cash expense is Depreciation & Amortization (D&A). This was subtracted on the Income Statement to calculate Net Income, but no cash actually left the company. Therefore, we must add it back to reverse its effect.
Step 3: Adjust for Changes in Net Working Capital
This is the most nuanced part. Working capital accounts on the Balance Sheet (like Accounts Receivable, Inventory, Accounts Payable) represent a gap between accrual accounting and cash transactions. We must account for the change in these balances from one period to the next.
Here are the rules:
- Increase in an operating asset (e.g., Accounts Receivable, Inventory) → Use of Cash. Why? If Accounts Receivable went up, it means we recorded more revenue than we collected in cash. We subtract this increase.
- Decrease in an operating asset → Source of Cash. If Inventory went down, it means we sold goods without having to spend cash to replenish them in the same period. We add this decrease.
- Increase in an operating liability (e.g., Accounts Payable) → Source of Cash. Why? If Accounts Payable went up, it means we incurred expenses but haven't paid cash for them yet, effectively conserving our cash. We add this increase.
- Decrease in an operating liability → Use of Cash. If we paid down our Accounts Payable, cash has left the building. We subtract this decrease.
Let's watch a practical demonstration of this.
Build a 3 Statement Financial Model (FULL Tutorial + Free Template)
The video 'Build a 3 Statement Financial Model' by Kenji Explains provides an exceptionally clear walkthrough of building the CFO section, with great explanations for the working capital adjustments.
Watch the segment from 20:42 to 23:28. Pay close attention to how he explains the logic for why an increase in Accounts Receivable is a negative cash adjustment, while an increase in Accounts Payable is a positive one.
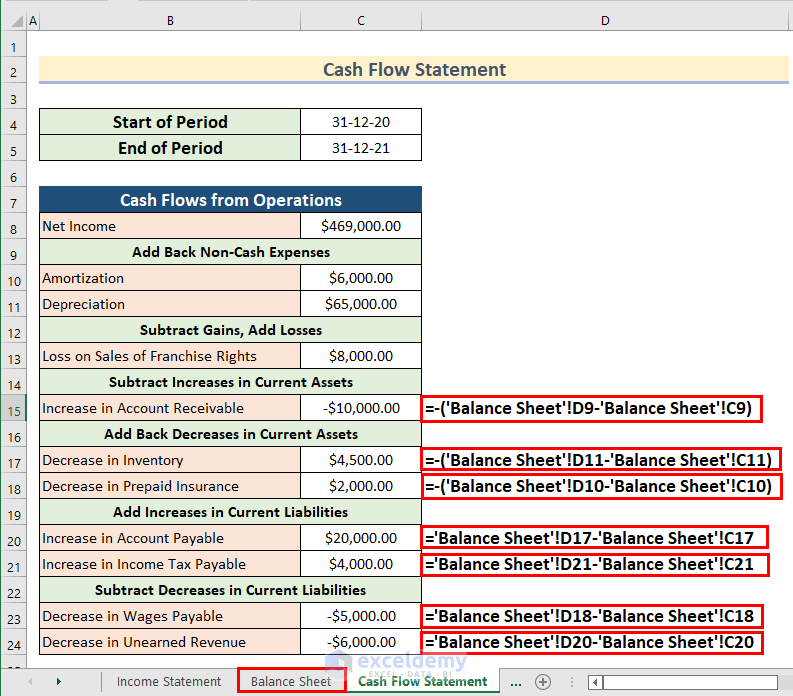
In Excel, the formula for these adjustments is simply Prior Period Balance - Current Period Balance for assets, and Current Period Balance - Prior Period Balance for liabilities.
3. Deriving CFI and CFF
These sections are generally more straightforward as they link directly to specific schedules we've already discussed.
Cash Flow from Investing (CFI)
This section primarily reflects investments in the long-term health of the company. The main line item is Capital Expenditures (CapEx), which is the cash spent on Property, Plant & Equipment (PP&E).
- Link: You'll link this from your CapEx or PP&E schedule.
- Sign: Since buying assets uses cash, CapEx is shown as a negative number (a cash outflow).
Cash Flow from Financing (CFF)
This section details cash flow between the company and its investors/lenders. The work you did in the last two lessons on debt and equity schedules feeds directly into here.
- Debt: The net change in debt (
Current Period Debt - Prior Period Debt) is a key driver. Issuing new debt is a cash inflow; repaying debt is a cash outflow. - Equity:
- Issuing new stock is a cash inflow.
- Repurchasing stock (Treasury Stock) is a cash outflow.
- Paying Dividends is a cash outflow. These are the exact numbers from the equity roll-forward schedules we built in the last lesson.
Now, let's see all three sections built sequentially in a live model.
How to Link the 3 Financial Statements in Excel
The video 'How to Link the 3 Financial Statements in Excel' from Corporate Finance Institute provides a complete, end-to-end demonstration of building the Cash Flow Statement.
Please watch from 25:54 to 31:41. The speaker builds the entire CFS. Observe how he: Starts with Net Income. Adds back Depreciation. Links the change in working capital from a supporting schedule. Links CapEx as the investing outflow. Calculates the cash impact from changes in debt and equity.
4. Completing the Cash Roll-Forward
Once CFO, CFI, and CFF are calculated, the final step is to sum them up to get the Net Change in Cash for the period.
With that, we can complete the cash roll-forward:
Where the Beginning Cash Balance is simply the Ending Cash Balance from the prior period's Balance Sheet.
The Ending Cash Balance we just calculated is the definitive cash amount the company has at the end of the period. This number is the final, critical link back to the Balance Sheet.
Test your understanding!
A company reports the following for a period:
- Net Income: $150
- Depreciation: $20
- Increase in Accounts Receivable: $30
- Decrease in Accounts Payable: $10
- Capital Expenditures (Purchase of equipment): $40
- Issued new Long-Term Debt: $50
- Paid Dividends: $15
Calculate the Net Change in Cash for the period.
Show answer
Let's break it down by section:
-
Cash Flow from Operations (CFO):
- Net Income: +$150
- Add back Depreciation: +$20
- Adjust for AR increase: -$30 (Use of cash)
- Adjust for AP decrease: -$10 (Use of cash)
- CFO = $150 + $20 - $30 - $10 = $130
-
Cash Flow from Investing (CFI):
- Capital Expenditures: -$40 (Use of cash)
- CFI = -$40
-
Cash Flow from Financing (CFF):
- Debt Issuance: +$50 (Source of cash)
- Dividends Paid: -$15 (Use of cash)
- CFF = $50 - $15 = $35
-
Net Change in Cash:
- CFO + CFI + CFF = $130 - $40 + $35 = $125
The company's cash balance increased by $125 during the period.
Conclusion
Excellent work. You have now derived the entire Cash Flow Statement by systematically linking the Income Statement and Balance Sheet. This process transforms static financial reports into a dynamic story of how a company generates and uses cash.
Key Takeaways:
- The Cash Flow Statement reconciles accrual-based Net Income to the actual change in cash.
- Cash Flow from Operations (CFO) starts with Net Income and adjusts for non-cash items (like D&A) and changes in operating balance sheet accounts (working capital).
- Cash Flow from Investing (CFI) is primarily driven by capital expenditures, which are linked from the PP&E schedule.
- Cash Flow from Financing (CFF) is driven by changes in debt and equity, linking directly to the debt and equity schedules we built previously.
- The final Ending Cash Balance is the "answer" that will be used to complete and balance the Balance Sheet.
In our next lesson, we'll experience the "moment of truth." We will integrate all supporting schedules to complete the three-statement model and troubleshoot to ensure the balance sheet balances. You will link the Ending Cash Balance we calculated today back to the Balance Sheet and see the entire model come together.