Welcome to the first lesson of Module 4, "Three-Statement Financial Model Construction." This module marks a significant step in your journey, as we transition from analyzing and forecasting individual components to building a fully integrated financial model from the ground up.
In the previous module, you learned how to use statistical methods like regression to forecast financial outcomes based on key drivers. We'll continue with the theme of driver-based forecasting, but now we will apply it to the balance sheet, using operational metrics as our drivers.
Today’s lesson focuses on a critical part of any financial model: the working capital schedule. You will learn how to construct supporting schedules for working capital items (AR, AP, Inventory) based on operational drivers (DSO, DPO, DIO).
By the end of this lesson, you will be able to:
- Define the key operational drivers: Days Sales Outstanding (DSO), Days Inventory Outstanding (DIO), and Days Payables Outstanding (DPO).
- Use these drivers to forecast the future balances of Accounts Receivable, Inventory, and Accounts Payable.
- Structure a clean and dynamic working capital schedule in a financial model.
This schedule is the engine that connects a company's operational efficiency to its balance sheet and, ultimately, its cash flow. Let's begin.
1. Understanding Working Capital and its Drivers
In financial modeling, we are primarily concerned with Net Operating Working Capital (NOWC). This represents the capital a business needs to fund its day-to-day operations. It is typically calculated as:
NOWC = (Accounts Receivable + Inventory) - Accounts Payable
To forecast these three accounts, we don't just guess a growth rate. Instead, we use efficiency ratios that link them to the company's operational activity on the Income Statement. These ratios measure time and are expressed in "days":
- Days Sales Outstanding (DSO): How many days does it take to collect cash after a sale?
- Days Inventory Outstanding (DIO): How many days does inventory sit on the shelves before it's sold?
- Days Payables Outstanding (DPO): How many days does the company take to pay its own bills?
These "days" metrics are standard assumptions you will find in any FP&A model. Let's explore each one.
2. Accounts Receivable and Days Sales Outstanding (DSO)
Accounts Receivable (AR) represents money owed to your company by customers for goods or services already delivered. The key driver for AR is DSO.
To understand DSO in detail, please read the following article. It provides a clear definition, the formula, and its importance for liquidity.
Days Sales Outstanding (DSO) | Formula + Calculator
This article from Wall Street Prep, 'Days Sales Outstanding (DSO)', will give you a solid foundation on this key metric.
Please read the first three sections: 'What is Days Sales Outstanding?', 'How to Calculate Days Sales Outstanding (DSO)', and 'Days Sales Outstanding Formula (DSO)'. Focus on understanding what DSO measures and the standard formula used to calculate it.
As you read, you saw the formula for calculating historical DSO is:
For forecasting, we simply rearrange this formula. We make an assumption about the future DSO (based on historical trends or strategic goals) and use it to project the future Accounts Receivable balance.
This direct link between an operational assumption (DSO) and a financial statement item (AR) is the essence of driver-based modeling.
3. Inventory and Days Inventory Outstanding (DIO)
Next is Inventory, which includes raw materials, work-in-progress, and finished goods. Its driver is Days Inventory Outstanding (DIO), which tells us how efficiently the company is managing its inventory.
Let's turn to another excellent resource from Wall Street Prep to understand DIO.
Days Inventory Outstanding (DIO) | Formula + Calculator
This article, 'Days Inventory Outstanding (DIO)', explains the concept in a similar fashion to the DSO article.
Please read the sections 'What is Days Inventory Outstanding?' and 'Days Inventory Outstanding Formula (DIO)'. Pay attention to how DIO is linked to the Cost of Goods Sold (COGS), not Revenue.
The standard formula for historical DIO is:
Note the denominator: we use Cost of Goods Sold (COGS) because inventory is valued at cost on the balance sheet.
To forecast the Inventory balance, we again rearrange the formula, using our DIO assumption:
4. Accounts Payable and Days Payables Outstanding (DPO)
Finally, Accounts Payable (AP) represents the money your company owes to its suppliers. The driver for AP is Days Payables Outstanding (DPO). A higher DPO means the company is taking longer to pay its bills, which can be a source of short-term financing but can also strain supplier relationships if it gets too high.
The formula for historical DPO is analogous to the others:
Like inventory, AP is typically linked to COGS, as many of the bills a company has to pay are for the direct inputs of production.
And for forecasting, the rearranged formula is:
The following video shows a professional modeler calculating these historical day metrics. Watching this will help solidify the formulas in your mind before we use them for forecasting.
How to Build a Forecasting Model in Excel (FP&A)
This clip from the Corporate Finance Institute's video 'How to Build a Forecasting Model in Excel (FP&A)' demonstrates the calculation of historical working capital days.
Watch the section from 07:17 to 09:23. Notice how the analyst uses the Balance Sheet (AR, Inventory, AP) and Income Statement (Revenue, COGS) accounts to calculate the historical 'days'. We will be using these exact formulas, but rearranged to solve for the balance sheet items.
5. Building the Working Capital Schedule
Now that we understand the drivers, we can assemble the schedule. A good schedule has three parts:
- Inputs/Assumptions: A clearly labeled section for your DSO, DIO, and DPO assumptions.
- Calculations: Rows where you calculate the balances for AR, Inventory, and AP using the formulas we just discussed.
- Outputs: The calculated Net Working Capital and, crucially, the Change in Net Working Capital from one period to the next. This "change" is what will eventually link to our Cash Flow Statement.
Here is an example of what a complete working capital schedule looks like in Excel:
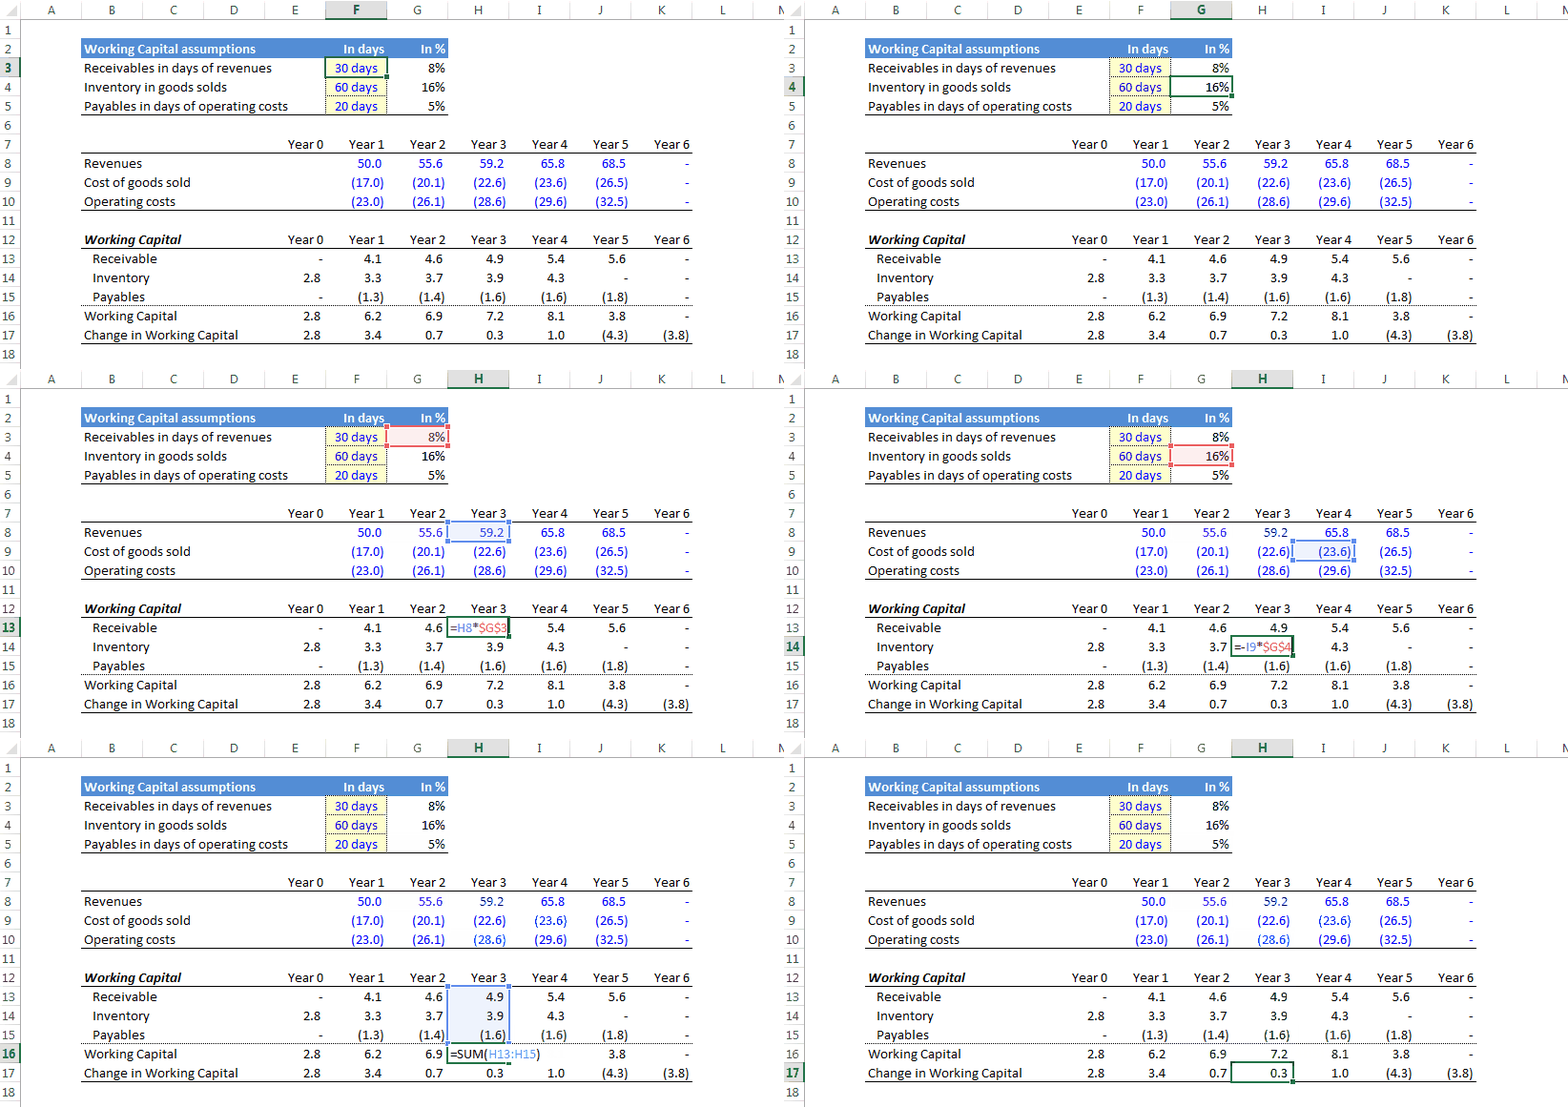
To build this:
- Your DSO, DIO, and DPO assumptions are your inputs.
- You will need forecast values for Revenue and COGS (which would come from your Income Statement forecast).
- For each forecast year, you calculate:
Receivables = (DSO / 365) * RevenueInventory = (DIO / 365) * COGSPayables = (DPO / 365) * COGS
- Then you calculate
Net Working Capital = Receivables + Inventory - Payables. - Finally, you calculate
Change in Working Capital = NWC_current_period - NWC_prior_period.
Test your understanding!
Let's build a forecast for Year 1. You have the following assumptions and projections:
Assumptions:
- DSO: 45 days
- DIO: 60 days
- DPO: 30 days
Projections:
- Revenue: $2,000,000
- COGS: $1,200,000
Calculate the forecasted ending balances for Accounts Receivable, Inventory, and Accounts Payable for Year 1.
Show answer
- Accounts Receivable:
(45 / 365) * $2,000,000 = $123,288 - Inventory:
(60 / 365) * $1,200,000 = $197,260 - Accounts Payable:
(30 / 365) * $1,200,000 = $98,630
These values would be the ending balances on your Year 1 forecasted Balance Sheet.
Conclusion
Congratulations, you have just learned how to build one of the most important supporting schedules in a three-statement model. The logic you mastered today is fundamental to FP&A and corporate finance.
Key Takeaways:
- Net Operating Working Capital (AR + Inventory - AP) is a crucial component of a company's cash flow.
- We forecast these balance sheet items using operational efficiency drivers: DSO, DIO, and DPO.
- The forecasting formulas are rearrangements of the standard "days" calculation formulas:
AR = (DSO / 365) * RevenueInventory = (DIO / 365) * COGSAP = (DPO / 365) * COGS
- A well-structured working capital schedule clearly separates assumptions from calculations and calculates the period-over-period change, which is a vital input for the Cash Flow Statement.
In our next lesson, we will continue building out our model by constructing another essential supporting schedule: the schedule for Capital Expenditures (CapEx) and Depreciation. This will be another step towards creating a fully integrated and dynamic financial model.