Hello! Welcome back to our course on becoming an FP&A Analyst.
In our last lesson, we started building out the key supporting schedules for our three-statement model by tackling the working capital schedule. You learned how to use operational drivers like DSO, DIO, and DPO to forecast Accounts Receivable, Inventory, and Accounts Payable.
Today, we continue this crucial process by focusing on another fundamental component of any financial model: fixed assets. The learning outcome for this lesson is to model a capital expenditure (CapEx) schedule and its corresponding depreciation schedule using various methods.
We'll break down how companies plan for major investments and how the cost of those investments is recognized over time. Your background in civil engineering will be an asset here, as you're already familiar with the concepts of large-scale projects and long-lived assets. Today, we'll translate those concepts into the language of financial modeling.
By the end of this lesson, you will be able to:
- Distinguish between Capital Expenditures (CapEx) and Operating Expenses (Opex).
- Structure a CapEx planning schedule.
- Calculate depreciation using different methods, focusing on the straight-line approach.
- Build a dynamic depreciation schedule using a "waterfall" or "vintage" structure.
- Construct a PP&E roll-forward schedule and link all the components to the three financial statements.
Let's get started.
1. CapEx vs. Opex: A Core Distinction
Before we build any schedules, we must be crystal clear on what counts as a capital expenditure. An investment in a new factory is treated very differently from the monthly electricity bill for that factory.
A capital expenditure (CapEx) is the use of funds to acquire, upgrade, and maintain physical assets such as property, buildings, an industrial plant, technology, or equipment. An operating expense (Opex), on the other hand, is an expense a business incurs through its normal business operations.
To grasp the practical implications for an FP&A analyst, please read the following sections from a comprehensive guide by PivotXL.
Capex & Depreciation Models in Excel for FP&A| Chapter 17
This article, 'Capex & Depreciation Models in Excel for FP&A', provides an excellent overview. We'll start with the fundamentals.
Please read sections 17.1 ('Why Capex & Depreciation Models Matters in FP&A') and 17.2 ('Capex & Depreciation Models vs Opex: A Critical Distinction'). Focus on the three ways CapEx affects the financial statements and the key characteristics that differentiate it from Opex.
As the article emphasizes, the key FP&A rule of thumb is: If the benefit lasts beyond 12 months, it's likely CapEx. This decision has a profound impact on the financial statements:
- Income Statement: Opex is expensed immediately, reducing profit in the current period. CapEx is not. Its cost is spread over its "useful life" via depreciation.
- Balance Sheet: CapEx increases the value of assets (specifically, Property, Plant & Equipment or PP&E). Opex has no direct asset impact.
- Cash Flow Statement: Both CapEx and Opex result in cash outflows. However, CapEx is reported under Cash Flow from Investing, while Opex-related cash flows are part of Cash Flow from Operations.
2. Structuring the CapEx and PP&E Schedules
A robust financial model doesn't just have a single number for "CapEx." It details the planned investments and tracks the company's entire asset base over time. This is done with two core schedules: the CapEx Planning Schedule and the PP&E Roll-Forward.
The CapEx Planning Schedule
This schedule is the starting point—it's an input sheet where you list all planned capital projects. It acts as the "assumptions" driver for your fixed asset calculations.
A best-practice layout includes columns for:
- Asset Category (e.g., IT, Manufacturing, Vehicles)
- Project Name
- Start Date (when the asset is put into service)
- Cost
- Useful Life (in years)
- Depreciation Method
The PP&E Roll-Forward Schedule
This schedule provides a summary of all movements in the company's fixed asset base. It's the bridge from one period's Balance Sheet to the next and follows a simple, powerful formula:
- Beginning PP&E: The ending balance from the previous period.
- CapEx: The sum of all new investments from your CapEx planning schedule for the current period.
- Depreciation: The total depreciation expense for all assets (both old and new) for the current period.
- Ending PP&E: The final balance that will appear on the current period's Balance Sheet.
The following reading explains how these components fit together.
Capex & Depreciation Models in Excel for FP&A| Chapter 17
Let's return to the PivotXL article to see how to structure these schedules in a model.
Please read section 17.4 ('Capex & Depreciation Models Planning Schedule in Excel') and section 17.6 ('Fixed Asset Roll-Forward Schedule'). Focus on the table structures and the core roll-forward formula.
Now that we have the framework, we need to populate the most complex piece: the depreciation calculation.
3. Modeling Depreciation
Depreciation is the mechanism for allocating the cost of a tangible asset over its useful life. While there are several methods, our main focus will be on the one most commonly used in FP&A models.
To understand the different approaches, please review this resource from Wall Street Prep.
Depreciation Expense | Formula + Calculation Tutorial
This article, 'Depreciation Expense', clearly explains the common methods for calculating depreciation.
Read the sections 'How to Calculate Depreciation Expense' and 'Straight-Line vs. Accelerated Depreciation'. Note the formulas for Straight-Line, Double Declining Balance, and Units of Production methods. Pay attention to why companies often prefer the straight-line method for financial reporting.
As you've read, the three main methods are:
-
Straight-Line: Spreads the cost evenly across each period. This is the simplest and most widely used method in corporate financial modeling due to its predictability. The formula is:
For modeling purposes, Salvage Value is often assumed to be $0. -
Accelerated (e.g., Double Declining Balance): Expenses a larger portion of the asset's value in the early years of its life. This is often used for tax purposes to get larger tax deductions sooner.
-
Units of Production: Bases depreciation on the asset's usage rather than the passage of time. This is common for industrial machinery where wear and tear is directly related to output.
For our three-statement model, we will build a straight-line depreciation schedule.
The Depreciation "Waterfall"
The main challenge in modeling depreciation is that in any given year, the total depreciation expense is the sum of depreciation from assets bought this year, last year, the year before, and so on. We need to track the depreciation for each "vintage" (or cohort) of CapEx. This is often called a "waterfall" or "corkscrew" schedule.
The image below, from the Wall Street Prep article, shows this concept in action.
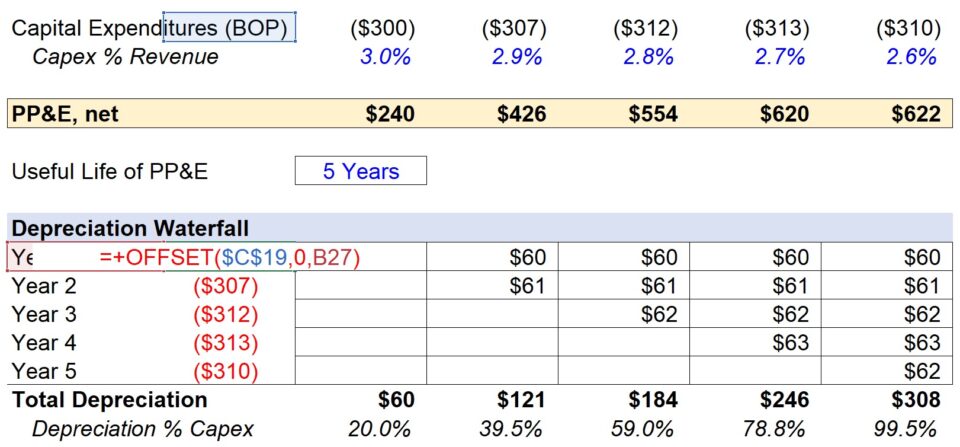
Here's how to interpret and build this:
- Each row starting with "2021 Capex," "2022 Capex," etc., represents a new group of assets purchased in that year.
- The annual depreciation for that group is calculated (e.g., for 2021,
$300k Capex / 5 years = $60kdepreciation per year). - That
$60kis then spread across the next five years (2021 through 2025). - The "Total Depreciation" for any year is the vertical sum of the depreciation expenses from all the different vintages active in that year. For example, Total Depreciation in 2023 is
$60k(from 2021 Capex) +$61k(from 2022 Capex) +$62k(from 2023 Capex) =$184k.
This same logic is shown in the "Classic Depreciation Schedule" image below, which also helpfully points out where the totals link to the main financial statements.
Test your understanding!
A company makes the following capital expenditures, all with a 4-year useful life and $0 salvage value:
- Year 1: $80,000
- Year 2: $120,000
Using the straight-line method, what is the Total Depreciation Expense for Year 2? And what is the Ending PP&E balance at the end of Year 2, assuming a starting PP&E of $0 at the beginning of Year 1?
Show answer
Depreciation Calculation:
- Depreciation from Year 1 CapEx: $80,000 / 4 years = $20,000 per year.
- Depreciation from Year 2 CapEx: $120,000 / 4 years = $30,000 per year.
- Total Depreciation in Year 2: This includes a full year of depreciation from both vintages. So, $20,000 (from Y1) + $30,000 (from Y2) = $50,000.
PP&E Roll-Forward:
- Year 1:
- Beginning PP&E: $0
- Add: CapEx: +$80,000
- Less: Depreciation: -$20,000
- Ending PP&E (Year 1): $60,000
- Year 2:
- Beginning PP&E (from end of Y1): $60,000
- Add: CapEx: +$120,000
- Less: Depreciation: -$50,000
- Ending PP&E (Year 2): $130,000
4. Linking to the Three Financial Statements
You've built the schedules and done the calculations. The final, critical step is to link these outputs to your three-statement model.
Capex & Depreciation Models in Excel for FP&A| Chapter 17
Let's conclude with the PivotXL article, which clearly explains how to integrate your schedules into the P&L and Cash Flow Statement.
Read sections 17.9 ('Linking Capex & Depreciation Models to the P&L') and 17.10 ('Capex & Depreciation Models and Cash Flow Statement Integration'). Focus on the tables that show exactly which line items are affected on each statement. Note the critical insight: Capex does not affect EBITDA, but it absolutely affects cash.
Here is a summary of the key linkages:
-
Income Statement:
- The
Total Depreciation Expensefrom your depreciation waterfall flows into the Income Statement as an operating expense (or sometimes within COGS), reducing pre-tax income.
- The
-
Cash Flow Statement:
- Cash Flow from Operations (CFO): Start with Net Income, then add back the
Total Depreciation Expensebecause it's a non-cash charge. - Cash Flow from Investing (CFI): The
Total CapExspend for the period is a subtraction (a use of cash).
- Cash Flow from Operations (CFO): Start with Net Income, then add back the
-
Balance Sheet:
- The
Ending PP&Ebalance from your roll-forward schedule becomes the PP&E asset value on the Balance Sheet for that period. This ensures the Balance Sheet balances, as the changes in cash and retained earnings (from net income) are offset by the change in PP&E.
- The
For a deeper dive into the Excel mechanics, you are encouraged to download and explore the practice files provided in section 17.14 of the PivotXL article.
Conclusion
Excellent work! You have now mastered the logic for building one of the most mechanically complex and important supporting schedules in a financial model. Understanding the flow of capital expenditures through the three financial statements is a cornerstone of financial analysis.
Key Takeaways:
- CapEx represents investments in long-term assets and is recorded on the Balance Sheet, while the cash outflow appears in the Investing section of the Cash Flow Statement.
- Depreciation is the non-cash expense that allocates the cost of CapEx over its useful life, impacting the Income Statement and being added back on the Cash Flow Statement.
- The PP&E roll-forward (
Beg PP&E + CapEx - Depr = End PP&E) is the central schedule that connects these activities and drives the PP&E balance on the Balance Sheet. - A "waterfall" schedule is the best practice for calculating total depreciation by summing the depreciation from different "vintages" of CapEx.
In our next lesson, we will build another key supporting schedule: a dynamic headcount schedule with salary escalations and variable benefit costs. This will drive the largest operating expense for many companies—Salaries and Wages.