Hello! Welcome to the first lesson in our new module, Relative Valuation and Market Comparables.
In the last module, we mastered Discounted Cash Flow (DCF) analysis, a form of intrinsic valuation. We learned to value a company based on its own future cash-generating ability. As we discussed, a DCF model's output is highly sensitive to its assumptions. Now, we will pivot to a completely different but equally important valuation philosophy: relative valuation.
This lesson kicks off our exploration of Comparable Company Analysis (CCA), often called "trading comps." Our goal is to define the criteria for selecting a relevant peer group of public companies. This is the foundational step; the quality of your entire analysis hinges on selecting the right companies to compare against. Think of it as ensuring you have a valid and reliable benchmark before you start measuring.
1. The Core Idea: What is Comparable Company Analysis?
At its heart, relative valuation is an intuitive concept you likely use in everyday life. How do you know if the price of a house is fair? You look at the prices of similar houses in the same neighborhood. Comparable Company Analysis applies this exact logic to businesses.
The core premise is that similar companies, subject to similar market forces and possessing similar characteristics, should be valued similarly by the market. We use valuation "multiples" or ratios (like Price-to-Earnings or Enterprise Value-to-EBITDA) to standardize these comparisons, much like using a "price per square foot" metric for houses.
Comparable Company Analysis Excel Walkthrough | Valuation Multiples
To start, let's watch a short clip from Kenji Explains that introduces this concept using the house analogy.
Watch the beginning of the video from 00:00 to 00:55. Notice how it frames valuation as comparing a target asset to similar assets.
As the video suggests, the process involves a few key steps.
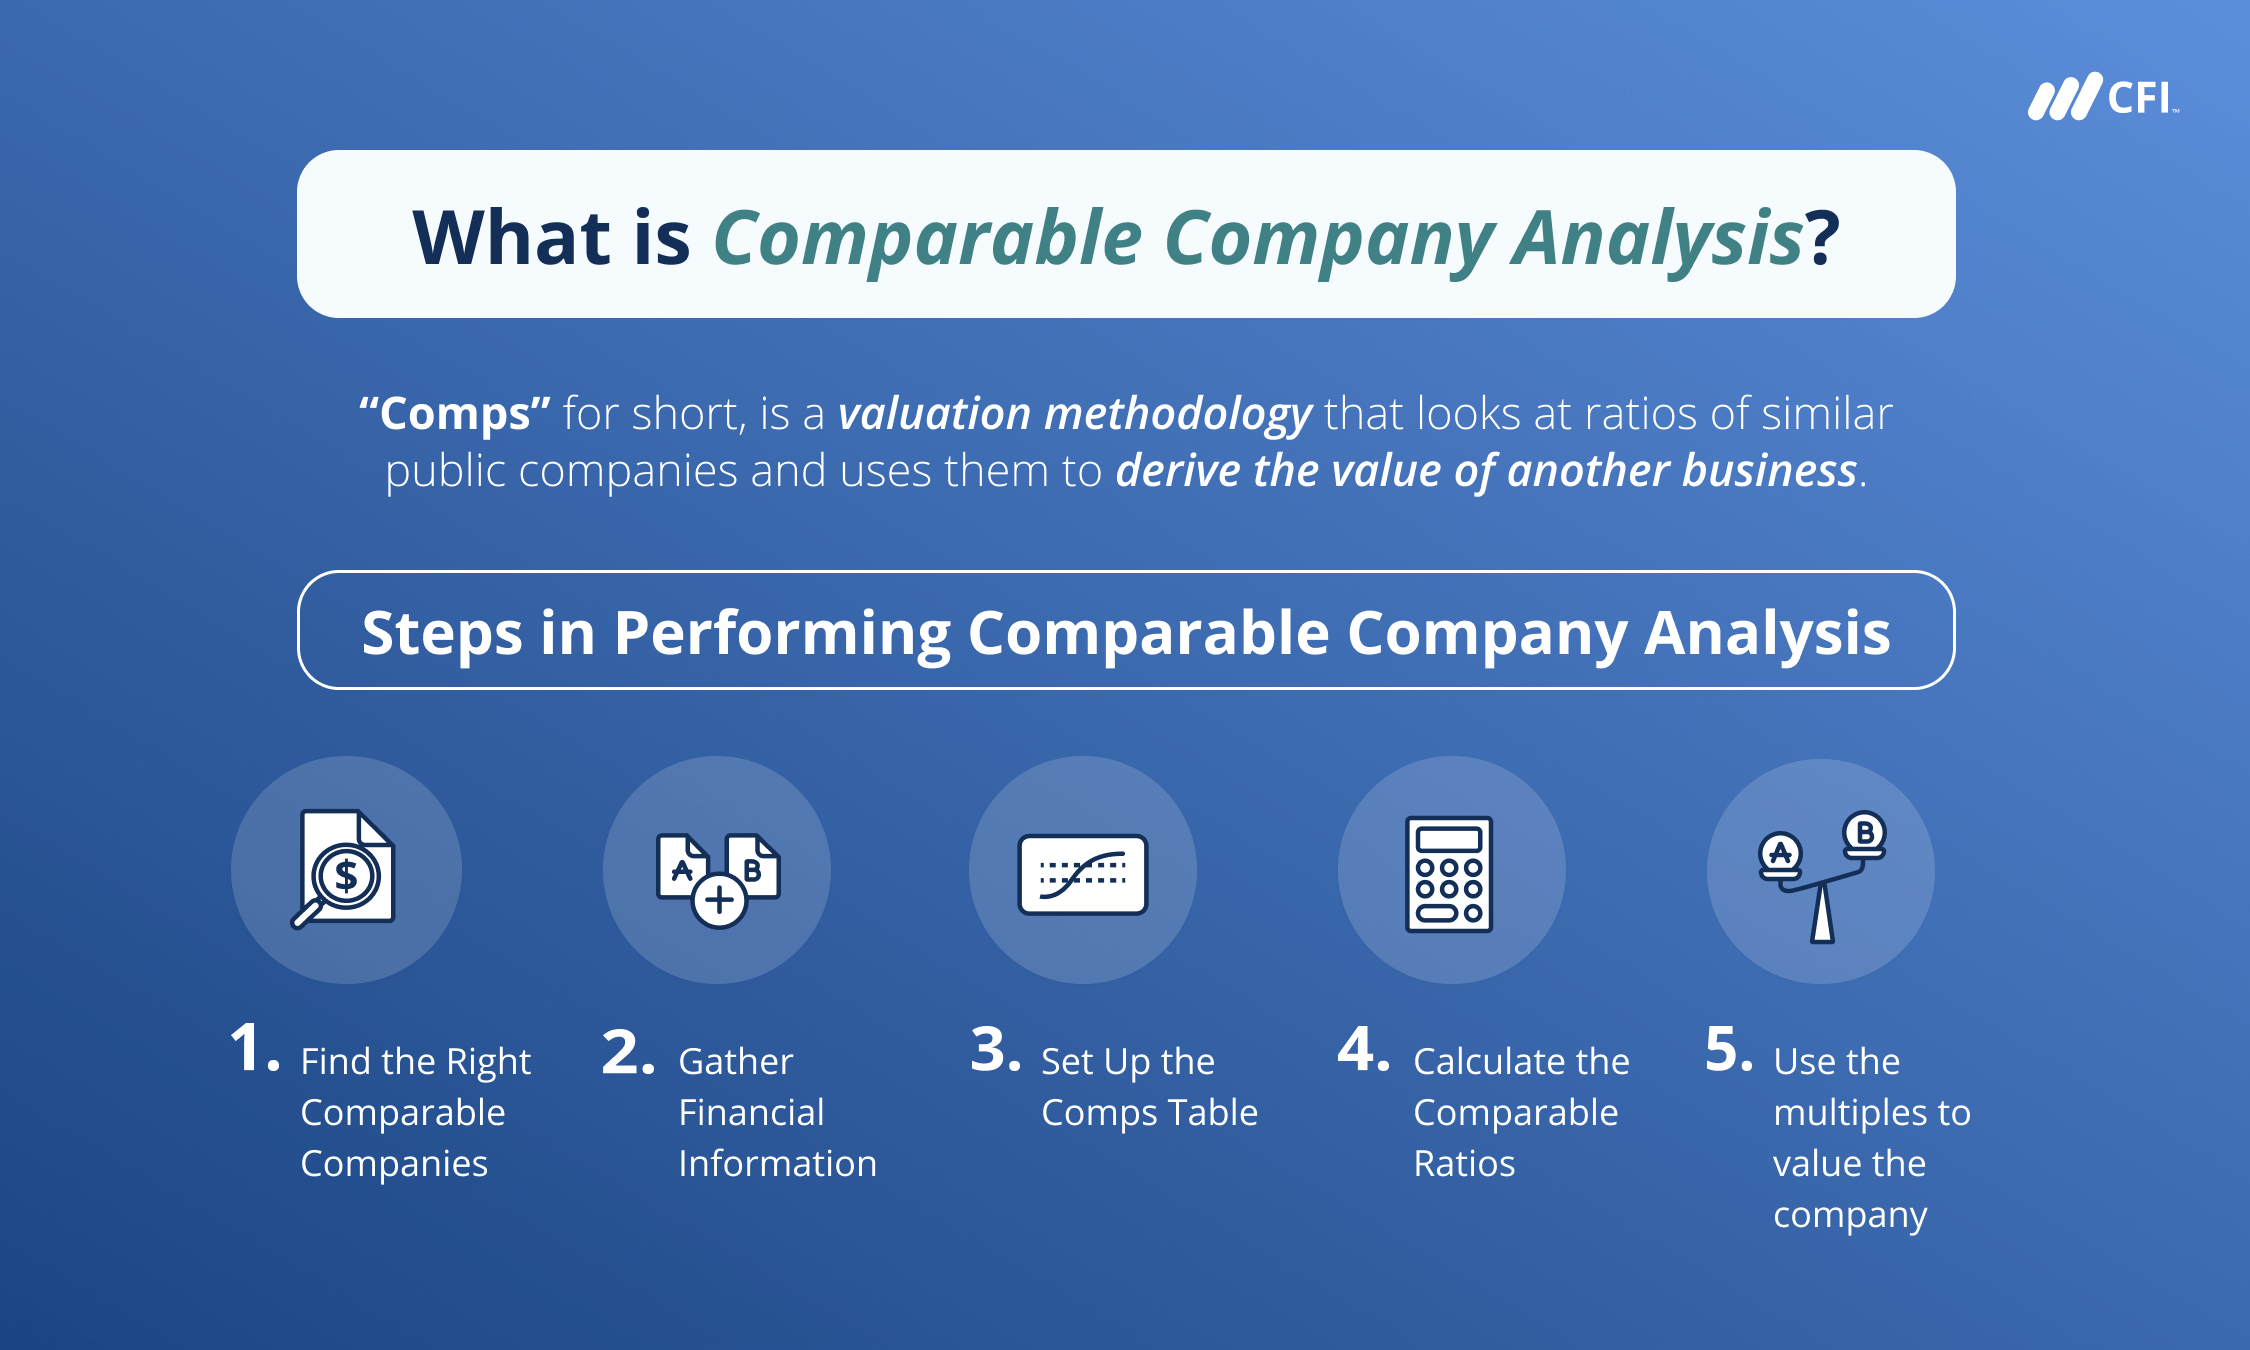
Before we dive into the "how," let's establish a formal definition.
Trading Comps Valuation Tutorial From Former JP Morgan Investment Banker! (Excel Template Included)
This video from former JP Morgan investment banker rareliquid provides a crisp, professional definition of Trading Comps, which is exactly how you would be expected to understand it in a high-finance setting.
Watch the section from 00:09:48 to 00:12:39. Pay attention to the key terms: 'relative valuation methodology', 'similar companies', and 'financial metrics'.
2. The Framework for Selecting Peers
Choosing a "peer group" is more methodical than it might seem. It's not enough to just pick companies in the same industry. A robust selection process requires you to screen companies across a range of business and financial characteristics to ensure they are truly comparable.
We can organize these criteria into two main buckets: Business Profile and Financial Profile.
How to Choose Comparable Companies
The following article from Wall Street Oasis provides an excellent, detailed framework for selecting comparable companies. It breaks down the business and financial profiles into clear, understandable components.
Please read the sections titled 'Framework for selecting comparable companies', 'Business profile in detail', and 'Financial profile in detail'. As you read, focus on understanding how each specific criterion (e.g., end markets, growth profile) helps to ensure a company is truly comparable to another.
Let's synthesize the key criteria from that reading:
A. Business Profile Criteria
This focuses on how the companies operate.
- Sector/Industry: This is the starting point. It's important to be specific. For example, "Technology" is too broad. You'd want to drill down to sub-sectors like "Enterprise Software," "Semiconductors," or "E-commerce."
- Products and Services: Companies should offer similar products. A luxury car manufacturer like Ferrari is not a good peer for a mass-market producer like Toyota, even though both are in the "automotive" sector.
- Customers and End Markets: To whom do they sell? A company selling components to other businesses (B2B) has a different risk and growth profile than one selling directly to consumers (B2C). Similarly, companies serving the same underlying "end market" (e.g., housing construction) will be affected by the same macroeconomic trends.
- Geography: Where do they operate and sell? For some industries like retail, this is critical. For others, like major oil and gas producers, global commodity prices are a more significant driver than location.
- Distribution Channels: How do products reach the customer? A company that sells through wholesale distributors will have a different cost structure and margin profile than a company that sells directly to consumers online.
B. Financial Profile Criteria
This focuses on the companies' financial performance and structure.
- Size: Typically measured by Market Capitalization, Revenue, or Assets. Large companies often benefit from economies ofscale and have different growth trajectories than small, high-growth startups. You want to compare companies of a similar scale.
- Profitability: Companies with higher profit margins (e.g., Gross Margin, EBITDA Margin) are generally perceived as being more efficient or having stronger pricing power, and the market often rewards them with higher valuation multiples.
- Growth Profile: What are the historical and projected growth rates for revenue and profit? High-growth companies typically command higher valuation multiples than mature, slow-growing ones.
- Return on Investment (ROI): Metrics like Return on Invested Capital (ROIC) or Return on Equity (ROE) measure how efficiently a company generates profit from the capital invested in it. Similar efficiency profiles suggest better comparability.
- Credit Profile: This refers to the amount of debt (leverage) a company carries and its ability to service that debt. Companies with vastly different risk profiles, as determined by their creditworthiness, are often not suitable peers.
Test your understanding!
You are tasked with valuing Peloton (a company selling high-end, connected fitness equipment with a recurring subscription service). From the list below, which company would be the least appropriate to include in its primary peer group and why, based on the criteria we just discussed?
a) Nautilus (sells a range of home fitness equipment, including brands like Bowflex)
b) Garmin (sells GPS-enabled fitness watches and other tech devices)
c) Planet Fitness (operates a chain of low-cost, membership-based physical gyms)
d) Lululemon (sells high-end, premium athletic apparel)
Show answer
The correct answer is (c) Planet Fitness.
While it's in the broad "fitness" industry, its business profile is fundamentally different from Peloton's.
- Products/Services: Planet Fitness offers a physical service (gym access), whereas Peloton offers a physical product integrated with a digital subscription service.
- Customers/End Markets: Planet Fitness targets the mass-market, low-cost segment. Peloton targets the premium, high-end market.
- Cost Structure: A physical gym chain has high fixed costs related to real estate, while Peloton's costs are centered on manufacturing, technology R&D, and marketing.
While the other companies aren't perfect peers, they share more relevant characteristics: Nautilus (a) is in the home equipment market, Garmin (b) is in the fitness tech hardware space, and Lululemon (d) targets a similar premium consumer demographic. Planet Fitness is the clear outlier.
3. The "Art" and "Science" of Peer Selection
Having a clear framework is the "science" part. The "art" lies in applying judgment, because perfect, "pure-play" comparables rarely exist. Most large companies operate across multiple business segments. Your task is to find the best available peers, not perfect ones.
Trading Comps Valuation Tutorial From Former JP Morgan Investment Banker! (Excel Template Included)
Let's watch the rareliquid video again to see how this works in practice. The presenter attempts to build a peer group for Apple, a notoriously difficult company to comp because of its unique mix of hardware, software, and services.
Watch the segment from 00:12:39 to 00:17:38. Note how he explicitly states it's 'more of an art than a science' and justifies his choices (e.g., including Samsung for its smartphone competition, Nvidia for hardware), while acknowledging the imperfections.
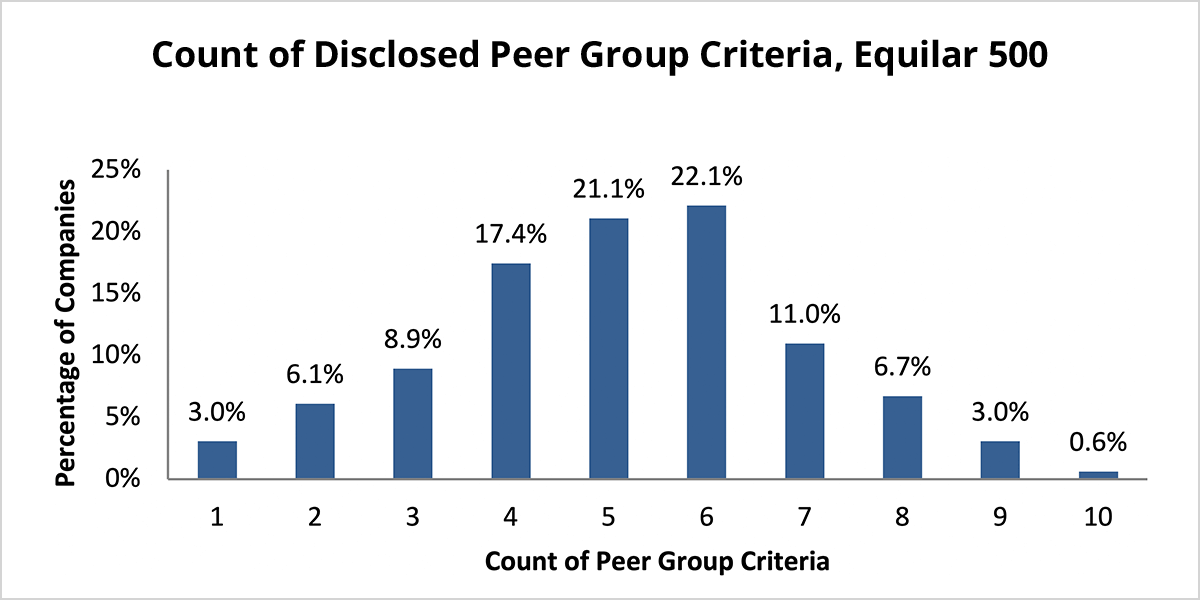
This exercise demonstrates that you must be able to defend your choices. So, how many criteria do professionals typically use?
4. How to Find Potential Peers
Now that you know what to look for, where do you find the names to begin your screening process?
Comparable Company Analysis Excel Walkthrough | Valuation Multiples
The Kenji Explains video offers some great starting points for sourcing potential comps.
Watch the section from 00:01:52 to 00:03:20. Pay attention to the two primary methods he suggests for finding an initial list of comparable companies.
As the video highlighted, here are the most common sources:
- Company Public Filings: A company's Annual Report (Form 10-K) will almost always have a "Competition" section where they list their key competitors. This is the best free and publicly available starting point.
- Financial Data Terminals: In a professional setting, you will use services like Bloomberg, Capital IQ, or FactSet. These platforms have powerful screening tools that allow you to find companies based on all the business and financial criteria we've discussed.
Conclusion
This lesson established the critical foundation for performing Comparable Company Analysis. You now have a robust framework for identifying and selecting a relevant peer group—the essential first step in any relative valuation exercise.
Key Takeaways:
- Comparable Company Analysis is a relative valuation method that values a company by comparing it to similar publicly traded businesses.
- Selecting the right peer group is the most important step, as a flawed peer group leads to a flawed valuation.
- Selection criteria are broken down into Business Profile (industry, products, customers, geography) and Financial Profile (size, growth, profitability, risk).
- Peer selection is both a science (using a structured framework) and an art (using judgment when perfect comps don't exist).
Preview of the Next Lesson:
Now that we know how to choose a peer group, what's next? In our next lesson, we will address the learning outcome: "Source and standardize financial data from public filings (10-K, 10-Q) for a comparable company analysis." We will roll up our sleeves and get into the practical work of gathering the necessary financial numbers and making adjustments to ensure our comparisons are truly "apples-to-apples."