Welcome back! In our last lesson, we established the framework for selecting a peer group, the critical first step in a Comparable Company Analysis (CCA). We learned that a well-chosen peer group, based on both business and financial characteristics, is the foundation of a credible relative valuation.
Today, we move to the second and more hands-on step of the process. This lesson will teach you how to source and standardize financial data from public filings (10-K, 10-Q) for a comparable company analysis. This is the detailed "grunt work" of an analyst, where precision and diligence are paramount. You will learn what data to look for, where to find it, and—most importantly—how to adjust it to ensure your comparisons are truly "apples-to-apples."
1. Identifying the Necessary Financial Data
Before diving into company filings, we need a clear shopping list. What data points are essential for a CCA? The data we gather will serve as the raw inputs for calculating the valuation multiples that are at the heart of this analysis.

Generally, for each company in your peer group, you will need to collect the following:
- Market Data:
- Current Share Price
- Basic and Fully Diluted Shares Outstanding
- Balance Sheet Data:
- Total Debt (both short-term and long-term)
- Cash and Cash Equivalents
- Income Statement & Cash Flow Data (for the Last Twelve Months - LTM):
- Revenue
- EBITDA (Earnings Before Interest, Taxes, Depreciation & Amortization)
- EBIT (Earnings Before Interest & Taxes, or Operating Income)
- Net Income
- Depreciation & Amortization (needed to calculate EBITDA if not stated directly)
Trading Comps Valuation Tutorial From Former JP Morgan Investment Banker! (Excel Template Included)
Let's begin with a quick review of the key financial metrics from the rareliquid video we saw in the last lesson. This will reinforce what we're looking for and why.
Watch the section from 03:22 to 09:38. Focus on the definitions of the key financial figures like Revenue, EBITDA, EBIT, and Net Income, as well as the components of Enterprise Value (Equity Value, Debt, Cash). This is our 'shopping list'.
2. Sourcing Data from Public Filings
With our list in hand, where do we go shopping? For publicly traded companies in the U.S., the primary, most reliable sources of financial data are their filings with the Securities and Exchange Commission (SEC).
To understand the professional sources for financial data, let's turn to an excerpt from a foundational investment banking textbook, 'Investment Banking: Valuation, LBOs, and M&A' by Rosenbaum & Pearl. This will give you a clear overview of what professional analysts use.
Read the sections 'STEP II. LOCATE THE NECESSARY FINANCIAL INFORMATION' and 'SEC Filings: 10-K, 10-Q, 8-K, and Proxy Statement'. Focus on understanding the purpose of each filing and the type of information you can find within it. Exhibit 1.4 provides an excellent summary.
As the reading explains, these are your key documents:
- Form 10-K (Annual Report): The most comprehensive and reliable source. It's filed annually and contains audited financial statements, a detailed Management's Discussion & Analysis (MD&A) section, and extensive footnotes that are crucial for our work.
- Form 10-Q (Quarterly Report): Filed for the first three quarters of a company's fiscal year. The financial data is typically unaudited but provides the most recent performance figures needed to calculate LTM data.
- Form 8-K (Current Report): Filed to announce major events that shareholders should know about, such as quarterly earnings announcements, M&A deals, or changes in management. An earnings press release (often filed as an exhibit to an 8-K) is usually the first place you'll find the most recent quarterly numbers.
These filings can all be found for free on the SEC's EDGAR (Electronic Data Gathering, Analysis, and Retrieval) database or, more conveniently, in the "Investor Relations" section of a company's own website.
3. Practical Data Extraction into Excel
Manually copying data is time-consuming and error-prone. As an analyst focused on productivity, you should leverage tools to automate this process where possible. Excel's Power Query is a powerful feature for this.
How To Import Company Financials Into Excel
The following video by 'Pete - HowToAnalyst' is a fantastic practical demonstration of modern data-gathering techniques. He shows how to pull financial tables directly from websites and PDF filings into Excel.
Watch the entire video. Pay close attention to the 'Get Data from Web' and 'Get Data from PDF' features found under Excel's 'Data' tab. Notice how he uses the Power Query editor to perform basic cleaning, like promoting headers and removing unnecessary columns.
While automated tools are powerful, you will always need to do some manual "spreading" of the numbers, which involves digging into the filings to find specific details not present in clean data tables. This is especially true for the next step.
4. The Analyst's Core Task: Standardizing Financials
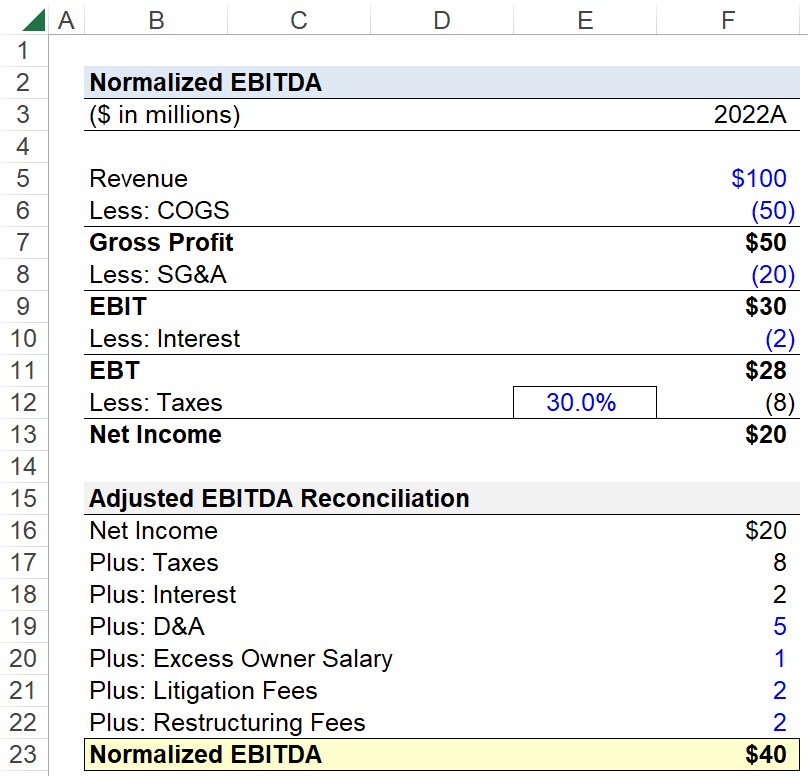
This is the most critical part of the process and where you, as an analyst, add significant value. Simply pulling reported (GAAP) numbers is not enough. To ensure a true "apples-to-apples" comparison, you must standardize, or normalize, the data by adjusting for non-recurring items.
These are one-time gains or losses that are not part of a company's normal, ongoing operations and can distort its perceived performance. Failure to adjust for them will lead to misleading valuation multiples.
Let's return to the Rosenbaum & Pearl textbook to understand the theory behind normalization.
Read the sections 'Adjustments for Non-Recurring Items' and 'Adjustments for Recent Events'. Focus on the why (to get a 'normalized' basis) and the what (examples of charges and gains to look for).
Common non-recurring items to look for include:
- Restructuring charges (e.g., severance, facility closures)
- Gains or losses on the sale of assets
- Goodwill or other asset impairments
- Losses from litigation settlements
- Inventory write-offs
This process is often called "scrubbing" the financials. You are cleaning the data to reflect the company's core operational earning power.
Finding the Adjustments
This is detective work. These items are rarely broken out on the face of the income statement. You must comb through the MD&A and footnotes to the financial statements in the 10-K and 10-Q. Use keyword searches (Ctrl+F) for terms like "non-recurring," "unusual," "one-time," "restructuring," and "impairment."
Non-Recurring Charges on the Income Statement
The Breaking Into Wall Street article provides another excellent, direct explanation of this process. It offers practical 'Easy' and 'Hardcore' methods for finding these items.
Read the sections 'How Do You Find Non-Recurring Charges?', 'The Hardcore Method...', and 'Do You Adjust for Non-Recurring Charges?'. Note the two key criteria for making an adjustment: Is it truly non-recurring, and does it impact the metric you're calculating?
Test your understanding!
You are analyzing a company for your peer group. Its reported EBIT for the year is $500 million. In the footnotes of its 10-K, you find the following two items mentioned in the MD&A:
- A pre-tax restructuring charge of $75 million related to the closure of an unprofitable factory.
- A $20 million increase in raw material costs due to supply chain issues, which management expects to persist for the next few years.
What is the company's normalized EBIT for your comparable analysis?
Show answer
The normalized EBIT is $575 million.
Here's the logic:
- Reported EBIT: $500 million
- Restructuring Charge: This is a classic non-recurring item. The factory closure is a one-time event, not part of normal operations. You add back the full pre-tax charge. +$75 million.
- Increased Raw Material Costs: Although this hurts profit, it is an operating reality for the business. Management expects it to continue, so it's not a one-time, non-recurring event. You do not adjust for this. +$0 million.
Normalized EBIT = $500M + $75M = $575M.
Conclusion
In this lesson, you have learned the practical and essential process of gathering and preparing data for a Comparable Company Analysis. This work forms the bedrock upon which your entire valuation will be built.
Key Takeaways:
- A CCA requires specific data points, including market data (share price, count), balance sheet items (cash, debt), and performance metrics (Revenue, EBITDA, EBIT, Net Income).
- The primary, most reliable sources for this data are a company's SEC filings: the 10-K, 10-Q, and 8-K.
- Modern Excel tools can help automate data extraction, but manual review is always necessary.
- Standardizing or normalizing financial data by adjusting for non-recurring items is a critical step to ensure a true "apples-to-apples" comparison. This requires careful detective work in the MD&A and footnotes.
Preview of the Next Lesson:
Now that we have gathered and standardized our raw data, we are ready to perform the first set of critical calculations. In the next lesson, we will use this data to calculate the Market Capitalization and Enterprise Value for each company in our peer group. These values will serve as the "numerators" in the valuation multiples that we will use to value our target company.