Hello! Welcome back to our course.
In our last lesson, we did the essential "grunt work" of sourcing and standardizing the financial data for our peer group from public filings. We now have the raw ingredients: share price, shares outstanding, cash, debt, and key performance metrics like EBITDA and Net Income.
Today, we will use that data to complete the next critical step in our Comparable Company Analysis (CCA). Our goal is to calculate the Market Capitalization and Enterprise Value for each company in the peer group. These two metrics represent the value of a company from different perspectives and will form the numerators of the valuation multiples we will build in our next lesson. Understanding the distinction between them is fundamental to any financial valuation.
1. The Two Pillars of Value: Equity Value and Enterprise Value
Before we jump into Excel, we need to establish a firm conceptual understanding of our two target metrics: Equity Value and Enterprise Value.
- Equity Value (or Market Capitalization): This represents the value of the company that is attributable only to the common equity shareholders. It's the value you see quoted in the stock market.
- Enterprise Value (or Total Enterprise Value, TEV): This represents the value of the company's core business operations to all capital providers—that includes equity holders, debt holders, and any other stakeholders. It is independent of a company's capital structure, making it ideal for comparing companies with different levels of debt.
To build a solid foundation, let's start with a detailed definition and the formulas for these concepts.
Enterprise Value (TEV) | Formula + Calculator
The following article from Wall Street Prep provides a clear, detailed breakdown of Enterprise Value. It explains why it is a capital structure-neutral metric and lays out the precise formula for its calculation.
Please read the sections 'What is Enterprise Value?', 'How to Calculate Enterprise Value', and 'Enterprise Value Formula'. Focus on understanding: The definition of Enterprise Value as the value to all stakeholders. Why it is considered 'capital structure-neutral'. The full formula for Enterprise Value and the logic for subtracting cash.
2. Conceptual and Intuitive Understanding
Formulas are essential, but a deep, intuitive understanding is what separates a great analyst from a good one. The following video provides excellent analogies and visual aids to help solidify these concepts.
Trading Comps Valuation Tutorial From Former JP Morgan Investment Banker! (Excel Template Included)
Now, let's watch a section from the 'Trading Comps Valuation Tutorial' by rareliquid. The presenter, a former JP Morgan investment banker, does an excellent job of explaining the intuition behind Equity Value and Enterprise Value and why certain financial metrics are paired with each.
Watch the segment from 03:22 to 09:38. Pay close attention to: The simple formula for Equity Value (Market Capitalization). The components of the Enterprise Value formula, particularly the concept of Net Debt (Debt - Cash). The crucial explanation for why Enterprise Value is paired with metrics like Revenue and EBITDA, while Equity Value is paired with Net Income.
3. Building the "Bridge" Between Equity and Enterprise Value
As you've just seen, Equity Value and Enterprise Value are intrinsically linked. A core skill for any financial analyst is the ability to move seamlessly between the two. We can visualize this relationship as a "bridge".
To go from Equity Value to Enterprise Value:
You start with the value to shareholders and add the claims of other capital providers.
- Start with Equity Value (Market Cap)
- + Total Debt
- + Preferred Stock
- + Non-Controlling Interest
- - Cash and Cash Equivalents
- = Enterprise Value
To go from Enterprise Value to Equity Value:
You start with the value of the total enterprise and subtract the claims of non-equity stakeholders to find the residual value left for common shareholders.
- Start with Enterprise Value
- - Total Debt
- - Preferred Stock
- - Non-Controlling Interest
- + Cash and Cash Equivalents
- = Equity Value (Market Cap)
The image below shows exactly how this flow works in an Excel model.

4. Practical Calculation in Excel
Now it's time to apply this theory. The ultimate goal is to create a table for your peer group that looks something like this, with Market Cap and Enterprise Value calculated for each company.
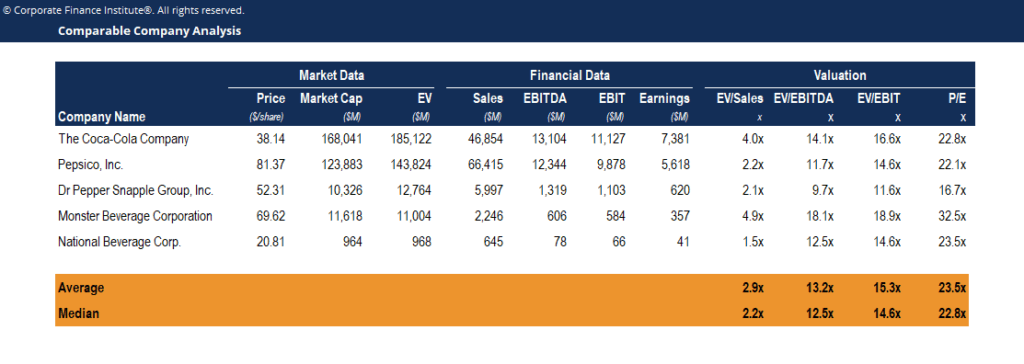
Let's watch a practical walkthrough of how to perform these calculations in Excel.
Comparable Company Analysis Excel Walkthrough | Valuation Multiples
The video 'Comparable Company Analysis Excel Walkthrough' by Kenji Explains provides a concise, step-by-step guide to calculating these values for a set of comparable companies.
Watch the section from 03:11 to 06:08. This will show you the exact Excel formulas for calculating Equity Value and Enterprise Value for a peer group. Then, briefly watch the section from 12:01 to 12:49, where he discusses some common real-world complexities, like diluted shares and other claims, which are important to be aware of for a rigorous analysis.
As the video mentions, for a simplified analysis, the formula Enterprise Value = Equity Value + Debt - Cash is a very common starting point. For your goal of achieving "Wall Street" level proficiency, it's crucial to remember the more comprehensive formula that includes other claims like Preferred Stock and Non-Controlling Interests. You would find these on the company's balance sheet, which you learned how to source in the last lesson.
Test your understanding!
You are analyzing Company X, a peer for your target company. From its latest 10-Q and market data feeds, you have gathered the following information:
- Current Share Price: $50.00
- Shares Outstanding: 200 million
- Total Debt (Short-term and Long-term): $4,000 million
- Cash and Cash Equivalents: $1,500 million
- Preferred Stock: $500 million
- Non-Controlling Interest: $0
Calculate Company X's (1) Market Capitalization and (2) Enterprise Value.
Show answer
1. Market Capitalization (Equity Value):
- Formula: Share Price × Shares Outstanding
- Calculation: $50.00 × 200 million = $10,000 million (or $10 billion)
2. Enterprise Value:
- Formula: Equity Value + Total Debt + Preferred Stock + Non-Controlling Interest - Cash
- Calculation: $10,000M + $4,000M + $500M + $0M - $1,500M = $13,000 million (or $13 billion)
Alternatively, you could first calculate Net Debt:
- Net Debt = Total Debt - Cash = $4,000M - $1,500M = $2,500M
- Enterprise Value = Equity Value + Net Debt + Preferred Stock + NCI = $10,000M + $2,500M + $500M + $0M = $13,000 million
Conclusion
Congratulations! You have now learned how to calculate the two most important top-line valuation metrics for any company. Building this bridge between what the market tells you (Equity Value) and the total value of the business operations (Enterprise Value) is a cornerstone of financial analysis.
Key Takeaways:
- Market Capitalization (Equity Value) is the value attributable to common shareholders (
Share Price × Shares Outstanding). - Enterprise Value (TEV) is the value of a company's core operations to all capital providers and is independent of capital structure.
- The full Enterprise Value formula is
Equity Value + Debt + Preferred Stock + NCI - Cash. A common simplification isEquity Value + Net Debt. - The "bridge" allows you to calculate one metric from the other by accounting for the claims of all non-equity stakeholders.
Preview of the Next Lesson:
We have successfully calculated the numerators for our valuation multiples. In the next lesson, we will combine these with the standardized financial metrics we gathered (Revenue, EBITDA, Net Income) to calculate and interpret common trading multiples like EV/Revenue, EV/EBITDA, and P/E. This is where our analysis starts to reveal how the market is valuing our peer companies relative to their performance.