Hello! Welcome back.
In our last lesson, we built the foundation for our valuation by calculating the Market Capitalization and Enterprise Value for our peer group. These represent the "price" in our analysis. Today, we'll put that price into context by relating it to financial performance.
Our goal for this lesson is to calculate and interpret common trading multiples, such as EV/Revenue, EV/EBITDA, and P/E. These ratios are the heart of Comparable Company Analysis (CCA), allowing us to standardize value and see how companies stack up against each other on a relative basis. This is how analysts begin to form a view on whether a company is "cheap" or "expensive."
1. What Are Valuation Multiples? The "Price Per Square Foot" for Companies
Before we dive into the specific formulas, it's helpful to use an analogy. Think about buying a house. If House A costs $500,000 and House B costs $750,000, which one is more expensive? You can't tell from the price alone. You need to standardize it. By calculating the price per square foot, you might find that House A is $500/sq.ft. while the larger House B is only $450/sq.ft., making it "cheaper" on a relative basis.
Valuation multiples do the same thing for companies. They standardize the value of a company (the numerator) against a key financial metric (the denominator) to enable meaningful comparisons.
Valuation Multiples: Full Tutorial, Excel, and Video
For a clear introduction to this idea, read the first part of the article 'Valuation Multiples: Full Tutorial, Excel, and Video' from Breaking Into Wall Street. It uses the same real estate analogy to explain the core concept.
Read the introductory section, up to the part that begins 'Examples of “Generalist” Valuation Multiples.' Focus on how multiples allow for an apples-to-apples comparison between companies of different sizes.
2. Defining the "Big Three" Trading Multiples
While many multiples exist, three are cornerstones of most financial analyses. As we review them, remember the critical rule of consistency we discussed in the last lesson:
- Enterprise Value (value to all stakeholders) is paired with metrics available to all stakeholders (i.e., before interest payments to debt holders).
- Equity Value (value to just shareholders) is paired with metrics that belong only to shareholders (i.e., after interest payments).
Let's define our key multiples based on this principle.
Valuation Multiples and Lecture Note Packet 2
The Breaking Into Wall Street article also provides concise definitions for our three main multiples. Additionally, the lecture notes from Professor Aswath Damodaran of NYU Stern—a leading authority on valuation—offer academically robust definitions.
First, read the section 'Examples of “Generalist” Valuation Multiples' in the Breaking Into Wall Street article. Then, for a more formal definition, quickly review the descriptions of PE and EV/EBITDA in Professor Damodaran's notes.
Lecture Note Packet 2 Relative Valuation and Private ...
From the Damodaran notes, focus on these specific definitions.
Read 'Example 1: Price Earnings Ratio: Definition' and 'Example 2: Enterprise Value /EBITDA Multiple'. Note how he defines the components of each multiple.
Here is a summary of the multiples and their common interpretations:
-
EV / Revenue (Enterprise Value / Revenue)
- What it shows: How much an investor is paying for every dollar of a company's sales.
- When it's used: Often for companies with negative profits or EBITDA (like early-stage tech companies) or in industries where revenue is a key driver of value (like SaaS). It's less affected by accounting differences in depreciation or interest expense.
-
EV / EBITDA (Enterprise Value / EBITDA)
- What it shows: How much an investor is paying for every dollar of a company's operational cash flow (EBITDA is a common proxy for this).
- When it's used: This is one of the most common multiples in finance because EBITDA is capital structure-neutral (pre-interest) and ignores differences in depreciation policy, making it great for comparing companies with different asset bases or leverage.
-
P/E (Price / Earnings, or Equity Value / Net Income)
- What it shows: How much an investor is paying for every dollar of a company's after-tax profits.
- When it's used: It's the most famous multiple, widely quoted in the media. It's useful for mature, consistently profitable companies. However, it can be distorted by different capital structures (leverage) and tax rates.
3. Calculating Multiples in Excel
Now, let's put theory into practice. With the data we organized and the EV/Market Cap we calculated in previous steps, calculating the multiples is a straightforward process in Excel.
The final output for this part of the analysis typically looks like this:
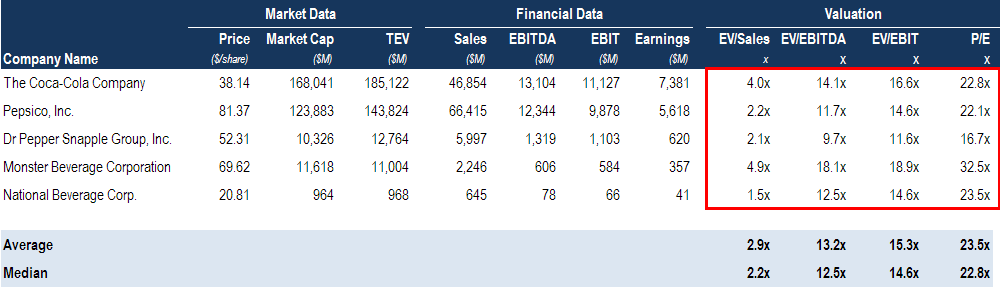
The following video provides an excellent, detailed walkthrough of how to perform these calculations and set up your analysis sheet.
Trading Comps Valuation Tutorial From Former JP Morgan Investment Banker! (Excel Template Included)
The 'Trading Comps Valuation Tutorial' by rareliquid will now guide you through the process of calculating the key multiples and associated growth rates and margins in Excel.
Watch the segment from 17:51 to 27:55. Follow along as the presenter: Pulls the necessary data (Revenue, EBITDA, Net Income) into the main table. Calculates growth rates and margins. Calculates the EV/Revenue, EV/EBITDA, and P/E multiples using the data gathered.
4. The Art of Interpretation: What Do the Numbers Mean?
Calculating the multiples is the science; interpreting them is the art. A higher multiple generally implies that the market has higher expectations for a company's future growth and profitability. A lower multiple might suggest a bargain, but it could also signal underlying business problems.
The key drivers that influence valuation multiples are:
- Growth: Faster-growing companies command higher multiples.
- Profitability: Companies with higher profit margins (e.g., higher EBITDA margins) are more valuable and receive higher multiples.
- Risk: Lower-risk companies (as measured by factors like cost of capital or stability of cash flows) are awarded higher multiples.
Trading Comps Valuation Tutorial From Former JP Morgan Investment Banker! (Excel Template Included)
Now, let's continue with the rareliquid video to learn how an analyst interprets these numbers. This is a crucial step that connects the data to a business narrative.
Watch the segment from 27:55 to 34:15. Pay close attention to the explanation of: What a multiple like '6.5x' actually means. What characterizes an 'expensive' vs. a 'cheap' company. How to analyze a company like NVIDIA (high growth, high margins, high multiple) versus a company like Meta/Facebook (strong metrics, but lower multiples due to perceived risks).
It is vital to remember that a single multiple is not a definitive answer. It's an indicator. A great analyst thinks of multiples as a doctor thinks of a blood test: a high reading doesn't automatically mean you're sick, but it tells the doctor where to investigate further.
Test your understanding!
You are analyzing two companies in the same industry, Company A and Company B.
- Company A: EV/EBITDA = 15.0x, Revenue Growth = 25%, EBITDA Margin = 30%
- Company B: EV/EBITDA = 8.0x, Revenue Growth = 5%, EBITDA Margin = 15%
Based only on this information, which of the following is the most reasonable initial conclusion?
a) Company B is clearly undervalued and a better investment.
b) Company A is overvalued because its multiple is almost double that of Company B.
c) Company A's higher multiple is likely justified by its superior growth and profitability profile compared to Company B.
d) The EV/EBITDA multiple is not a good metric for comparing these two companies.
Show answer
Answer: c) Company A's higher multiple is likely justified by its superior growth and profitability profile compared to Company B.
Reasoning: The market is willing to pay a premium (a higher multiple) for Company A because it is growing five times faster (25% vs. 5%) and is twice as profitable on an operational basis (30% vs. 15% margin). Company B's lower multiple reflects its weaker financial performance and lower growth prospects. While further analysis is needed, the multiples appear consistent with the underlying business fundamentals presented.
5. Benchmarking with Summary Statistics
Finally, to use these multiples for valuation, you need to establish a range from your peer group. This is done by calculating summary statistics. While the average is useful, the median is often preferred because it is less sensitive to extreme outliers.
Comparable Company Analysis Excel Walkthrough | Valuation Multiples
The 'Comparable Company Analysis Excel Walkthrough' by Kenji Explains gives a quick demonstration of how to calculate these benchmark statistics in Excel.
Watch the short clip from 07:27 to 08:55. Observe how to use the MAX, QUARTILE, AVERAGE, MEDIAN, and MIN functions to create a statistical summary of the multiples for the peer group.
Conclusion
In this lesson, you have taken a major step in your valuation journey. You've moved from raw data to insightful, comparative metrics that begin to tell a story about market perception and company performance.
Key Takeaways:
- Valuation multiples like EV/Revenue, EV/EBITDA, and P/E standardize a company's value to allow for comparison against peers.
- The choice of multiple depends on the rule of consistency: Enterprise Value pairs with pre-interest metrics (Revenue, EBITDA), while Equity Value pairs with post-interest metrics (Net Income).
- A multiple's level is driven by growth, profitability, and risk. Higher growth and profitability generally lead to higher multiples.
- Multiples are best used as indicators for further research, not as final conclusions. The median is often the most reliable central tendency measure for a peer group.
Preview of the Next Lesson:
We've now covered the essentials of Comparable Company Analysis, which looks at the value of similar companies in the public market. The other key type of relative valuation is Precedent Transaction Analysis, which looks at what buyers have paid for similar companies in M&A deals. In our next lesson, we will define the criteria for selecting comparable M&A transactions and learn how to source the data needed for this powerful valuation technique.