Hello! Welcome to the final lesson of our module on Discounted Cash Flow (DCF) Valuation.
In our last session, we successfully built the bridge from Enterprise Value to Equity Value and calculated a single, precise Implied Share Price. This is a significant achievement, but in the world of finance, a single number is rarely the whole story. A DCF model is built upon a foundation of assumptions about the future, each with its own degree of uncertainty.
This lesson tackles that uncertainty head-on. Our goal is to perform sensitivity analysis on key valuation assumptions (e.g., WACC, growth rate) using data tables. We will move beyond a single-point estimate to understand the range of possible valuations and identify which assumptions have the most significant impact on our final result. This is a critical skill for any FP&A professional, as it adds robustness and credibility to your financial analysis.
1. The "Why": Moving from a Point Estimate to a Range
A DCF valuation is highly sensitive to certain inputs. As you've seen, small changes to the Weighted Average Cost of Capital (WACC) or the terminal perpetuity growth rate can lead to substantial differences in the final share price. Relying on a single set of assumptions is risky.
Sensitivity analysis provides a solution by showing how the output (Implied Share Price) changes in response to changes in key inputs. In your civil engineering background, you would perform similar analyses, testing how a structure responds to varying load conditions or material strengths to understand its limits and safety factors. In finance, we test our valuation against different economic and company-specific scenarios.
DCF – Sensitizing for Key Variables
To understand the importance of this process, let's start with a resource that explains the need for sensitizing a DCF.
Please read the introduction ('What is Sensitizing DCF Analysis...'), 'Key Learning Points', and 'The Need for Sensitizing'. These sections from Financial Edge Training highlight why a DCF valuation is never complete without this analysis.
As the article notes, the WACC and terminal growth rate are two of the most powerful levers in a DCF model. Therefore, we will focus on building a two-variable data table to analyze their combined impact on the Implied Share Price.
2. The "How": Building a Two-Variable Data Table in Excel
Excel's "Data Table" feature is the perfect tool for this task. It automatically recalculates your model's output for every combination of two specified input variables. Let's walk through the process step-by-step.
For this process to work, you must have a fully integrated financial model where your key inputs (the drivers) are clearly defined and linked to the final output. Our work over the past few lessons has already established this.
Sensitivity Analysis Excel: Tutorial, Video, and Template
The following article from Breaking Into Wall Street provides a clear, practical guide to creating sensitivity tables in Excel. We will follow its structure.
Please read the sections from 'Sensitivity analysis in Excel' through 'Select the Entire Range and Create the Table'. This will guide you through the setup and creation of the table itself. Pay close attention to the screenshots and the structure of the table.
Let's summarize and crystallize the key steps from the article:
Step 1: Structure the Table
- Choose a blank area on the same spreadsheet as your key inputs and outputs.
- In the top row, enter the range of values for your first variable (e.g., WACC).
- In the first column, enter the range of values for your second variable (e.g., Terminal Growth Rate).
- Crucially, these values must be hard-coded or calculated from a hard-coded starting point (e.g.,
8.0%in the first cell,=PREVIOUS_CELL + 0.5%in the next). Do not link them to other parts of your model, as this can cause errors.
Step 2: Link the Output
- In the top-left corner cell of your table (at the intersection of the row and column headers), create a direct link to your final output cell. In our case, this would be the cell containing the Implied Share Price.
- This is the only cell in the table structure that should be linked to your model.
Step 3: Generate the Data Table
- Select the entire range of your table, including the row headers, column headers, and the linked output cell in the corner.
- Go to the Data tab in Excel's ribbon, click on What-If Analysis, and select Data Table.... (Keyboard shortcut:
Alt + A + W + T). - A dialog box will appear with two fields:
- Row input cell: Click into this field, then click on the original input cell in your model that corresponds to the variable in your table's top row (e.g., the cell where you input the WACC for your main DCF calculation).
- Column input cell: Click into this field, then click on the original input cell in your model that corresponds to the variable in your table's left column (e.g., the cell for the Terminal Growth Rate).
- Click OK. Excel will populate the table with the calculated share prices for each combination of inputs.
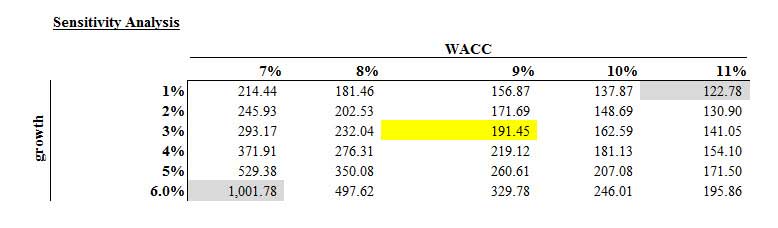
3. Interpreting the Results and Common Pitfalls
Once the table is populated, you need to check and interpret it.
Verification:
The resource from Breaking Into Wall Street (LINK) provides a good checklist.
Sensitivity Analysis Excel: Tutorial, Video, and Template
Let's review how to check your work and the key requirements for a successful data table.
Read the sections 'Check Your Work' and 'Key Requirements to Set Up the Tables'. This reinforces the critical rules you must follow.
Does the logic hold? As WACC increases, the implied share price should decrease. As the terminal growth rate increases, the implied share price should increase. If you see a whole row or column with the same value, something is wrong with your setup.
Common Pitfalls:
Building data tables can sometimes be frustrating. The resource from Financial Edge Training (LINK) outlines several common problems and their solutions.
DCF – Sensitizing for Key Variables
To prepare for real-world modeling, it's essential to know what can go wrong. This resource details common errors and how to fix them.
Read the section titled 'Data Tables: Common Pitfalls'. This is an invaluable guide for troubleshooting when your table doesn't work as expected.
Here are the most critical pitfalls to remember:
- Calculation Settings: Many financial models are set to "Automatic except for data tables" to prevent the workbook from slowing down. If your table doesn't calculate, check your settings under
File > Options > Formulas. You can manually force a recalculation by pressingF9. - Inputs on Different Sheets: The Data Table function requires the "Row input cell" and "Column input cell" to be on the same worksheet as the data table itself.
- Rounding Errors: Sometimes, the value in the center of your table (which should correspond to your base case) doesn't perfectly match your model's output. This is often because the hard-coded value in your table header (e.g., 8.5%) has fewer decimal places than the calculated value in your model (e.g., 8.5214%). To fix this, you can copy and "Paste as Value" the exact input from your model into the table header.
Test your understanding!
Imagine you have a DCF model on a worksheet named "DCF".
- The WACC input is in cell
C10. - The Terminal Growth Rate input is in cell
C11. - The final Implied Share Price output is in cell
C50.
You want to create a sensitivity table in the range G15:M21 on the same "DCF" worksheet. You plan to sensitize WACC along the top row (H15:M15) and the growth rate down the first column (G16:G21).
Describe the exact steps you would take to set up and generate this table, specifying what you would put in which cells and what you would enter into the Data Table dialog box.
Show answer
- Set up the Output Link: In cell
G15(the top-left corner), enter the formula=C50to link to the Implied Share Price. - Set up the Input Headers:
- In cells
H15throughM15, hard-code the different WACC values you want to test (e.g., 7.0%, 7.5%, 8.0%, etc.). - In cells
G16throughG21, hard-code the different Terminal Growth Rate values you want to test (e.g., 1.5%, 2.0%, 2.5%, etc.).
- In cells
- Select the Range: Select the entire table range, from
G15toM21. - Open the Data Table Tool: Go to Data > What-If Analysis > Data Table... (or use
Alt + A + W + T). - Fill the Dialog Box:
- In the "Row input cell" field, you would select cell
C10(the original WACC input). - In the "Column input cell" field, you would select cell
C11(the original Terminal Growth Rate input).
- In the "Row input cell" field, you would select cell
- Generate and Check: Click OK. The table
H16:M21will populate. You would then check if the share price decreases as you move right (higher WACC) and increases as you move down (higher growth rate).
Conclusion
You have now reached the end of the DCF Valuation module and have a complete, robust valuation tool at your disposal. You can not only calculate an intrinsic value per share but also understand and present the sensitivity of that valuation to its most critical underlying assumptions.
Key Takeaways:
- Sensitivity analysis is essential for understanding the risk and uncertainty inherent in a DCF valuation.
- A two-variable data table is the standard method for testing the combined impact of key drivers like WACC and terminal growth rate.
- The setup is methodical: structure the table with hard-coded headers, link the output in the corner, and correctly assign the original model inputs in the Data Table dialog box.
- Being aware of common pitfalls—like calculation settings, input locations, and rounding errors—is crucial for efficient and accurate modeling.
This powerful technique of modeling a range of outcomes is a cornerstone of professional financial analysis.
Preview of the Next Module:
So far, we have focused entirely on intrinsic valuation—valuing a company based on its own cash-generating ability. In our next module, "Relative Valuation and Market Comparables," we will pivot to a different approach. We will learn how to value a company by comparing it to its peers in the public markets and to similar companies that have recently been acquired. This will add another critical layer to your valuation skill set, allowing you to see a company's value from multiple perspectives.